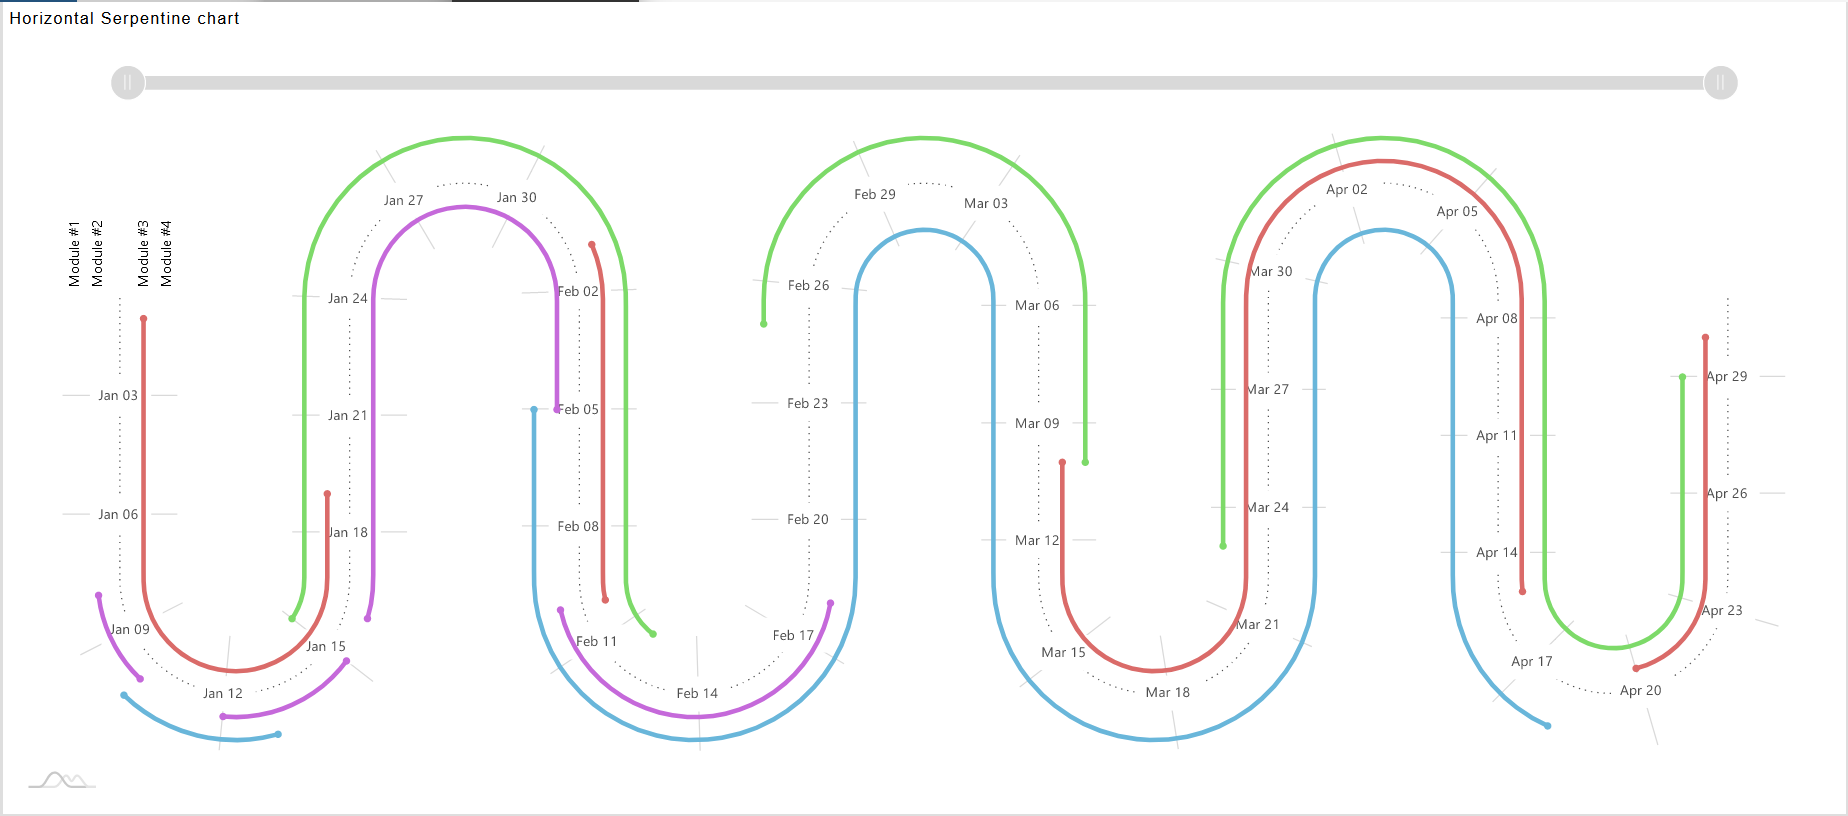
Custom Visualization Widget
The following code has all the properties of HTML, CSS, JS to make the chart, as shown in the figure image below:
HTML code
xxxxxxxxxx1
2
<script src="https://cdn.amcharts.com/lib/4/core.js"></script>3
<script src="https://cdn.amcharts.com/lib/4/charts.js"></script>4
<script src="https://cdn.amcharts.com/lib/4/plugins/timeline.js"></script>5
<script src="https://cdn.amcharts.com/lib/4/plugins/bullets.js"></script>6
<script src="https://cdn.amcharts.com/lib/4/themes/animated.js"></script>7
<div id="chartdiv"></div>8
JavaScript code
x
1
/**2
* ---------------------------------------3
* This demo was created using amCharts 4.4
* 5
* For more information visit:6
* https://www.amcharts.com/7
* 8
* Documentation is available at:9
* https://www.amcharts.com/docs/v4/10
* ---------------------------------------11
*/12
13
// Themes begin14
am4core.useTheme(am4themes_animated);15
// Themes end16
17
var chart = am4core.create("chartdiv", am4plugins_timeline.SerpentineChart);18
chart.curveContainer.padding(20,20,20,20);19
chart.levelCount = 8;20
chart.orientation = "horizontal";21
chart.fontSize = 11;22
23
var colorSet = new am4core.ColorSet();24
colorSet.saturation = 0.6;25
26
chart.data = [ {27
"category": "Module #1",28
"start": "2016-01-10",29
"end": "2016-01-13",30
"color": colorSet.getIndex(0),31
"task": "Gathering requirements"32
}, {33
"category": "Module #1",34
"start": "2016-02-05",35
"end": "2016-04-18",36
"color": colorSet.getIndex(0),37
"task": "Development"38
}, {39
"category": "Module #2",40
"start": "2016-01-08",41
"end": "2016-01-10",42
"color": colorSet.getIndex(5),43
"task": "Gathering requirements"44
}, {45
"category": "Module #2",46
"start": "2016-01-12",47
"end": "2016-01-15",48
"color": colorSet.getIndex(5),49
"task": "Producing specifications"50
}, {51
"category": "Module #2",52
"start": "2016-01-16",53
"end": "2016-02-05",54
"color": colorSet.getIndex(5),55
"task": "Development"56
}, {57
"category": "Module #2",58
"start": "2016-02-10",59
"end": "2016-02-18",60
"color": colorSet.getIndex(5),61
"task": "Testing and QA"62
}, {63
"category": "",64
"task": ""65
},{66
"category": "Module #3",67
"start": "2016-01-01",68
"end": "2016-01-19",69
"color": colorSet.getIndex(9),70
"task": "Gathering requirements"71
}, {72
"category": "Module #3",73
"start": "2016-02-01",74
"end": "2016-02-10",75
"color": colorSet.getIndex(9),76
"task": "Producing specifications"77
}, {78
"category": "Module #3",79
"start": "2016-03-10",80
"end": "2016-04-15",81
"color": colorSet.getIndex(9),82
"task": "Development"83
}, {84
"category": "Module #3",85
"start": "2016-04-20",86
"end": "2016-04-30",87
"color": colorSet.getIndex(9),88
"task": "Testing and QA"89
}, {90
"category": "Module #4",91
"start": "2016-01-15",92
"end": "2016-02-12",93
"color": colorSet.getIndex(15),94
"task": "Gathering requirements"95
},{96
"category": "Module #4",97
"start": "2016-02-25",98
"end": "2016-03-10",99
"color": colorSet.getIndex(15),100
"task": "Development"101
}, {102
"category": "Module #4",103
"start": "2016-03-23",104
"end": "2016-04-29",105
"color": colorSet.getIndex(15),106
"task": "Testing and QA"107
} ];108
109
chart.dateFormatter.dateFormat = "yyyy-MM-dd";110
chart.dateFormatter.inputDateFormat = "yyyy-MM-dd";111
112
var categoryAxis = chart.yAxes.push(new am4charts.CategoryAxis());113
categoryAxis.dataFields.category = "category";114
categoryAxis.renderer.grid.template.disabled = true;115
categoryAxis.renderer.labels.template.paddingRight = 25;116
categoryAxis.renderer.minGridDistance = 10;117
categoryAxis.renderer.innerRadius = -60;118
categoryAxis.renderer.radius = 60;119
120
var dateAxis = chart.xAxes.push(new am4charts.DateAxis());121
dateAxis.renderer.minGridDistance = 70;122
dateAxis.baseInterval = { count: 1, timeUnit: "day" };123
124
dateAxis.renderer.tooltipLocation = 0;125
dateAxis.startLocation = -0.5;126
dateAxis.renderer.line.strokeDasharray = "1,4";127
dateAxis.renderer.line.strokeOpacity = 0.7;128
dateAxis.tooltip.background.fillOpacity = 0.2;129
dateAxis.tooltip.background.cornerRadius = 5;130
dateAxis.tooltip.label.fill = new am4core.InterfaceColorSet().getFor("alternativeBackground");131
dateAxis.tooltip.label.paddingTop = 7;132
133
var labelTemplate = dateAxis.renderer.labels.template;134
labelTemplate.verticalCenter = "middle";135
labelTemplate.fillOpacity = 0.7;136
labelTemplate.background.fill = new am4core.InterfaceColorSet().getFor("background");137
labelTemplate.background.fillOpacity = 1;138
labelTemplate.padding(7,7,7,7);139
140
var categoryAxisLabelTemplate = categoryAxis.renderer.labels.template;141
categoryAxisLabelTemplate.horizontalCenter = "left";142
categoryAxisLabelTemplate.adapter.add("rotation", function (rotation, target) {143
var position = dateAxis.valueToPosition(dateAxis.min);144
return dateAxis.renderer.positionToAngle(position) + 90;145
})146
147
var series1 = chart.series.push(new am4plugins_timeline.CurveColumnSeries());148
series1.columns.template.height = am4core.percent(20);149
series1.columns.template.tooltipText = "{task}: [bold]{openDateX}[/] - [bold]{dateX}[/]";150
151
series1.dataFields.openDateX = "start";152
series1.dataFields.dateX = "end";153
series1.dataFields.categoryY = "category";154
series1.columns.template.propertyFields.fill = "color"; // get color from data155
series1.columns.template.propertyFields.stroke = "color";156
series1.columns.template.strokeOpacity = 0;157
158
var bullet = new am4charts.CircleBullet();159
series1.bullets.push(bullet);160
bullet.circle.radius = 3;161
bullet.circle.strokeOpacity = 0;162
bullet.propertyFields.fill = "color";163
bullet.locationX = 0;164
165
166
var bullet2 = new am4charts.CircleBullet();167
series1.bullets.push(bullet2);168
bullet2.circle.radius = 3;169
bullet2.circle.strokeOpacity = 0;170
bullet2.propertyFields.fill = "color";171
bullet2.locationX = 1;172
173
chart.scrollbarX = new am4core.Scrollbar();174
chart.scrollbarX.align = "center"175
chart.scrollbarX.width = am4core.percent(90);176
177
var cursor = new am4plugins_timeline.CurveCursor();178
chart.cursor = cursor;179
cursor.xAxis = dateAxis;180
cursor.yAxis = categoryAxis;181
cursor.lineY.disabled = true;182
cursor.lineX.strokeDasharray = "1,4";183
cursor.lineX.strokeOpacity = 1;184
185
dateAxis.renderer.tooltipLocation2 = 0;186
categoryAxis.cursorTooltipEnabled = false;187
CSS code
xxxxxxxxxx1
body {2
font-family: -apple-system, BlinkMacSystemFont, "Segoe UI", Roboto, Helvetica, Arial, sans-serif, "Apple Color Emoji", "Segoe UI Emoji", "Segoe UI Symbol";3
}4
5
#chartdiv {6
width: 100%;7
height: 600px;8
}9
10
.demo-theme-dark .demo-background {11
background: #000;12
}13
14