Conditionally Format your pivot widget

1. Click on hamburger icon.

2. Click on (+) icon, from dashboard tab.
3. The Edit menu box appears as you click on Pivot chart icon. And a widget gets added in content place automatically in dashboard.
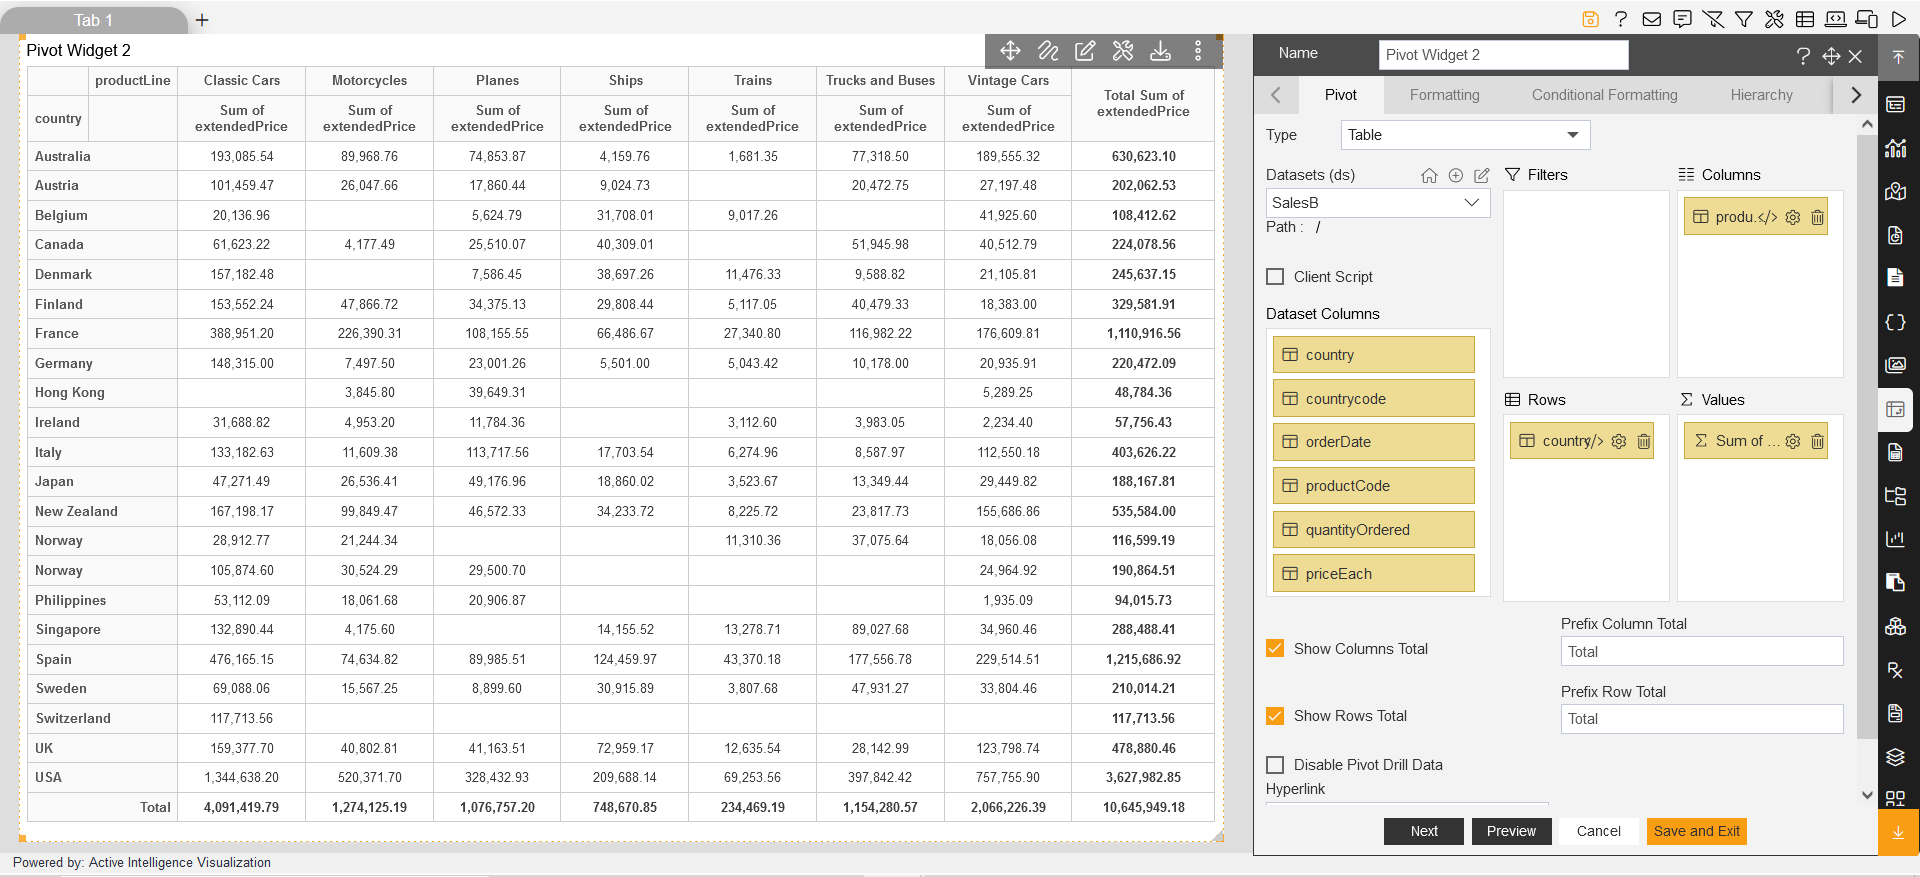
4. Add the Pivot chart in empty dashboard and add following details as follows:
Select type: Table
Select Dataset: SalesB.DS
Rows: "Drag and drop from value list" country
Columns: "Drag and drop from value list" ProductLine
Values: "Drag and drop from value list" Extended Price Note: Add Type: Sum after adding.
Click on preview button to see the outcome of above input.
5. Click on Conditional Formatting tab to add value formatting in pivot widget. as shown in figure below:
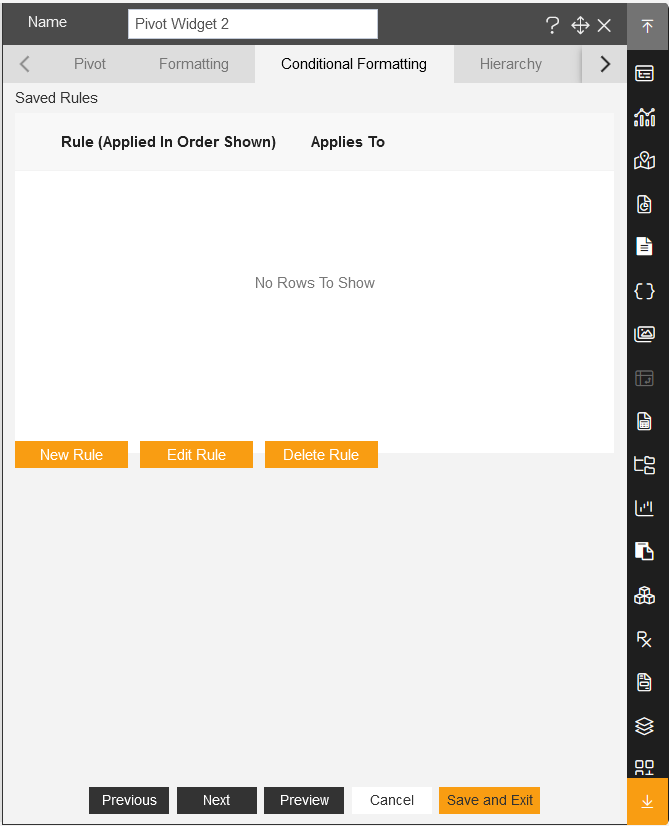
6. Click on New Rule Button from the middle of the menu bar, as user clicks on the New Rule, the value column will be added automatically in the Available Columns, as shows in figure below:
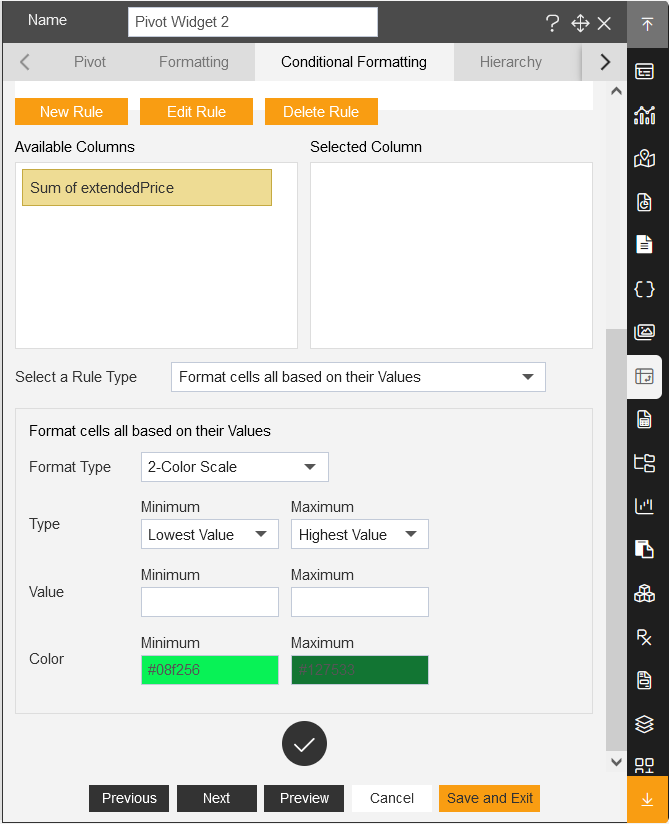
7. As use scroll down more controls appear to add Rule and it's condition. Now Drag and drop the Available Columns to the Selected Column as shown in figure below:
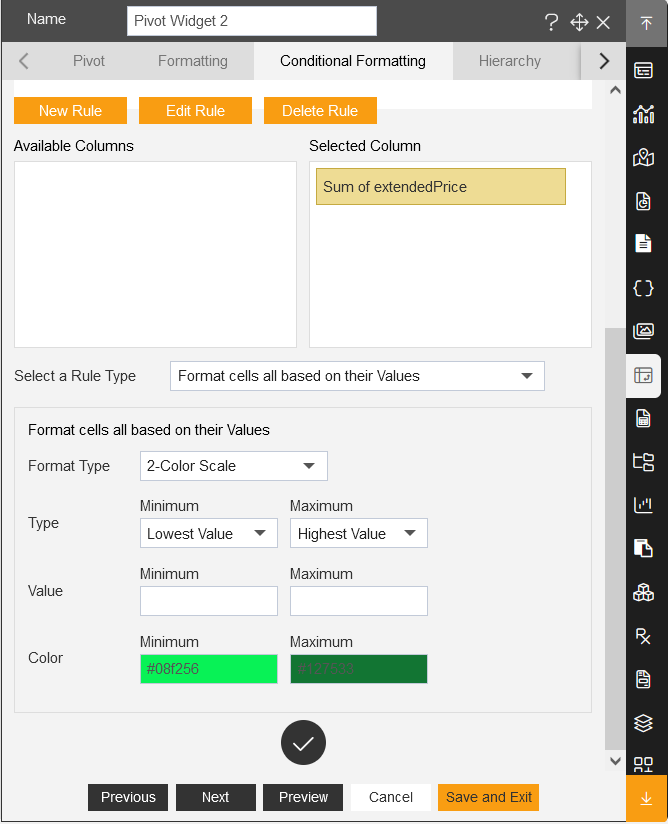
8. Now, add Minimum value: 2000 and Maximum value: 20000 for the condition, as shown in figure below:

9. To apply the condition to the pivot widget, click on the checkmark icon, as shown in figure below:

10. As user clicks the checkmark icon, the Pivot widget looks like as shown in figure below:

11. Click on Save and Exit and see the preview of widget.