Adding chart widget to the Ad-hoc Reports in the AIV application
In the previous section we learned how to add table widget to the Ad-hoc Reports. This section will teach you how to add chart widget to your Ad-hoc Report.
In order to create a chart follow the following steps:-
- You can insert a chart below another widget like table as follows:-
- You can also create chart on a new page as follows:-
- Drag and drop the chart to empty area as shown above:
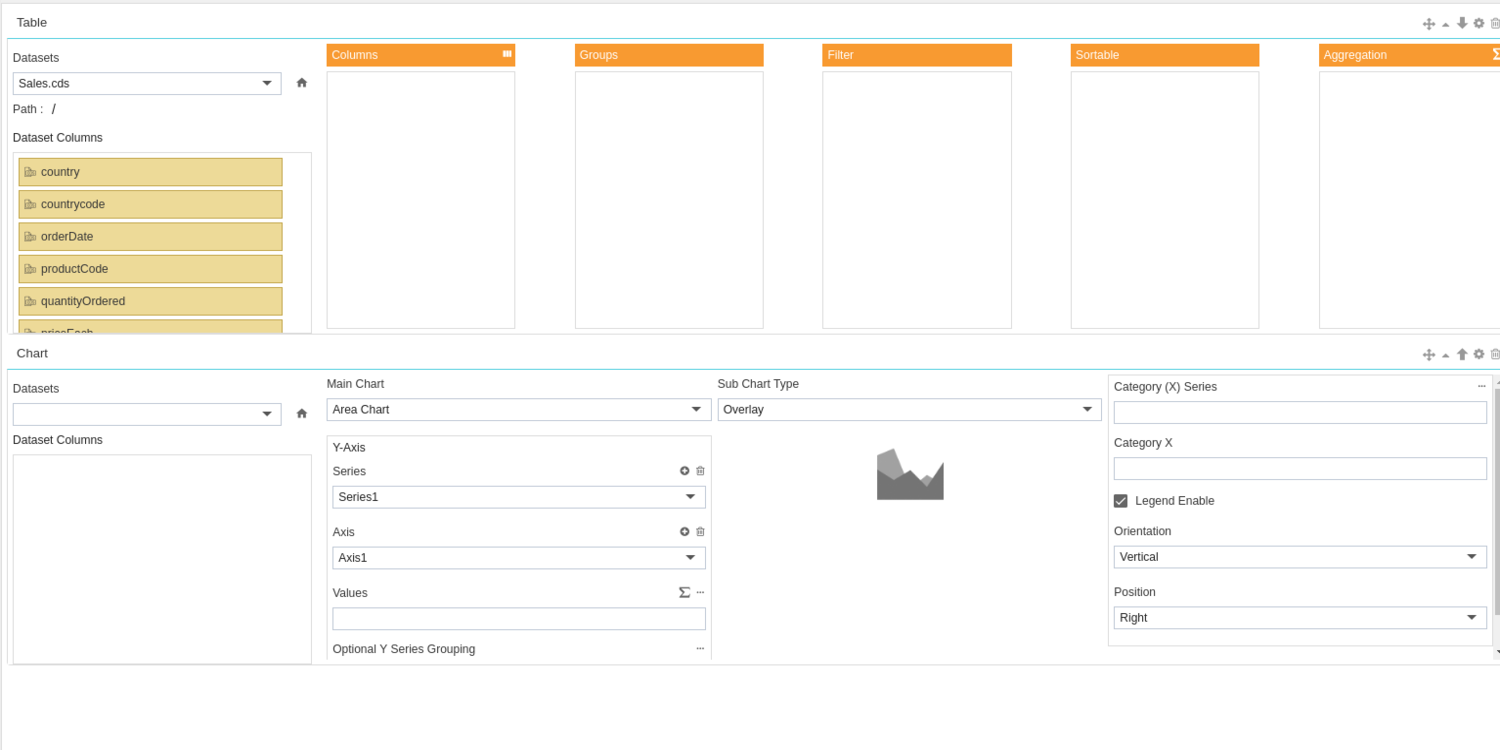
- Now from the drop down list of Datasets select the Sales.cds as follows:-
- You will see all the columns of the Dataset under Dataset Columns.
- Select Area chart in the Main Chart from the dropdown.
- In the sub-chart type select Overlay.
- Now drag and drop productName to Values in Y axis and country to optional Y series grouping.
- In the similar fashion, add productLine to Category X.
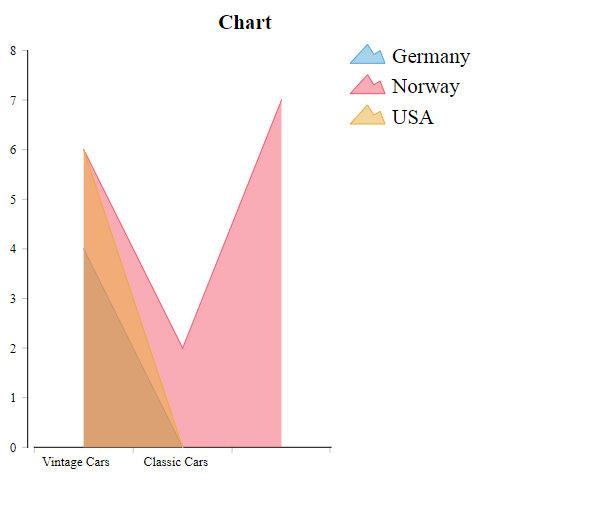
- Leave everything else as it is in the chart and run the chart as HTML in order to see the how chart is displayed.
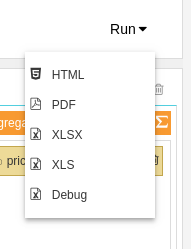
- In order to run the chart widget click on Run in the topmost right corner as follows:-
- For this example, we select Run as HTML.
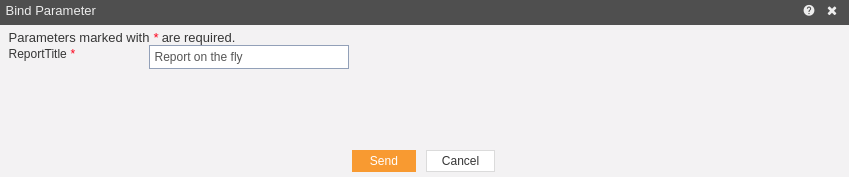
- Click on HTML which will open the following dialog box:-
- As the chart has no parameters, just click on Send.
- The following chart will be generated in HTML.
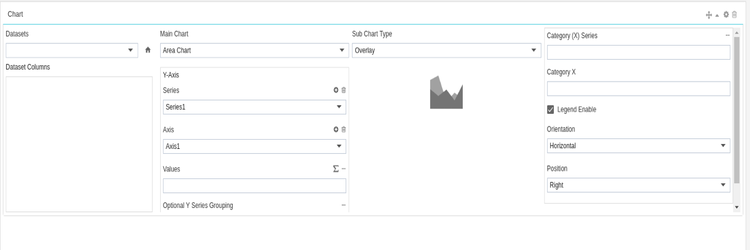
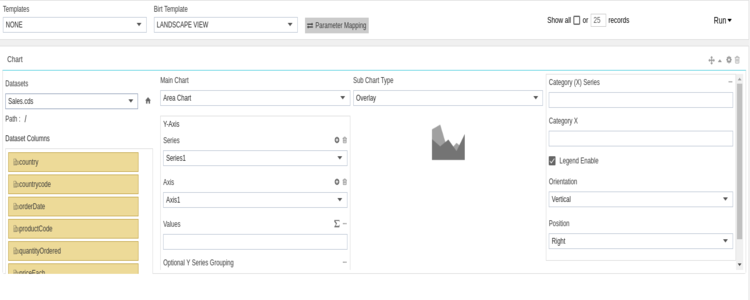
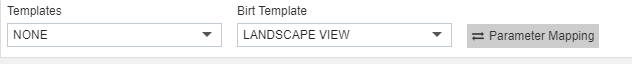
- You can change the template format from the BIRT Templates as follows:-
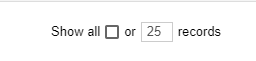
- You can also specify the number of records you want to show on a page from the following widget near the template selector widget:-
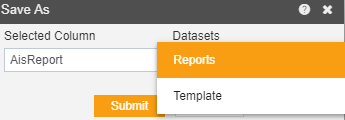
- If you want to save your chart you can click on the save button
 at the topmost right corner below admin which will open the following dialog box:-
 - You can give your own name in selected column, and select format as Report/Template and press submit button to perform save operation.
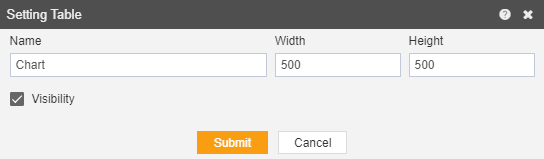
- If you want to change the settings of a widget click on
 below Run which will open the following dialog box:-
 - Here you can change name, width, height and visibility of your chart.
- Similarly press
 in order to delete the chart widget.
In the next section we will learn how to create image widgets.