Series > Series Value Label Position
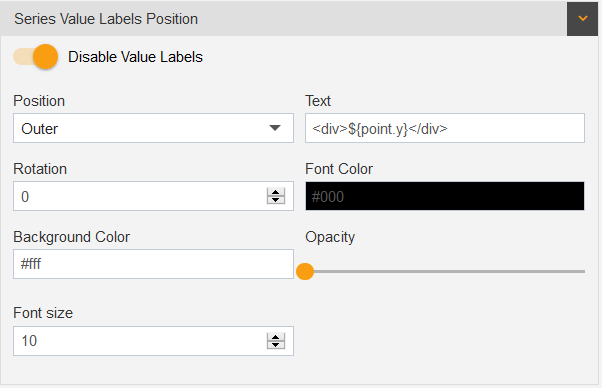
The Series Value Labels Position enables the user to add value labels in chart.

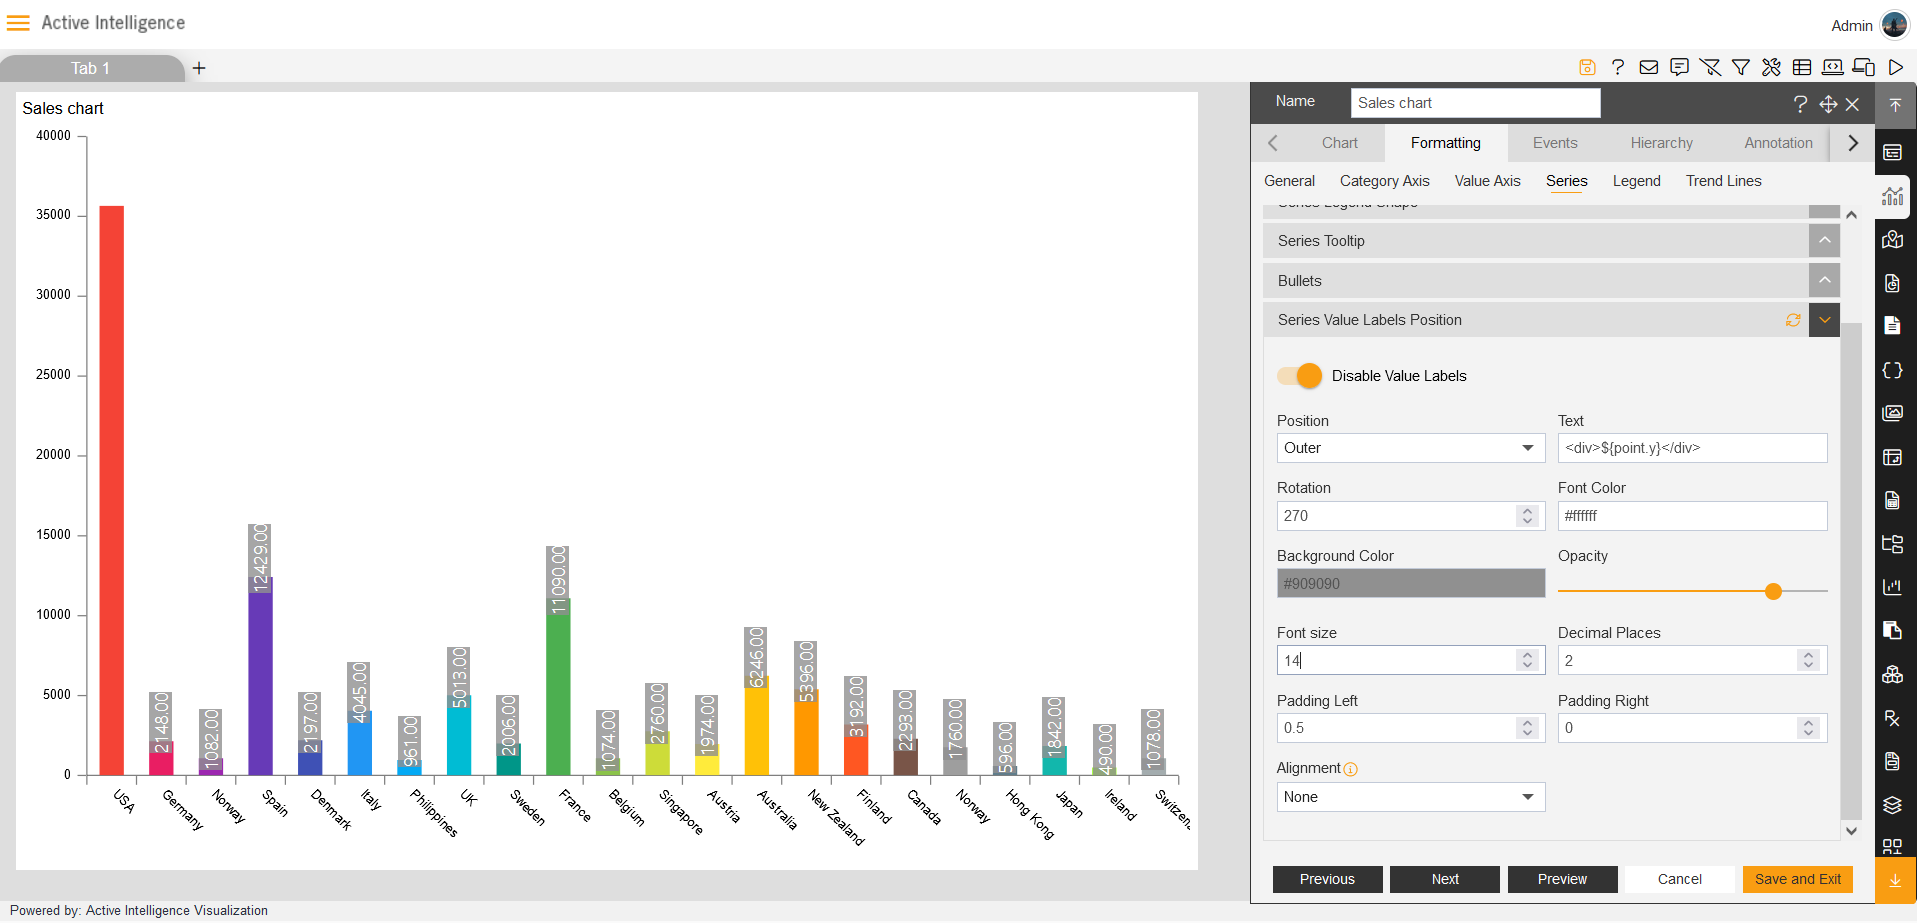
and make changes to the position, size, color and the alignment of value labels as shown below:

Position: In this feature, user can make changes to the position of series value labels by selecting from the options like Outer, Top, Bottom, Middle as per the requirement.
- Outer shifts the value labels in the outside position in the chart.
- Top shifts the value labels in the top position in the chart.
- Bottom shifts the value labels in the bottom position in the chart.
- Middle shifts the value labels in the middle position in the chart.
Text: It enables the user to put the text value in particular pattern, as shown in the above figure.
The textbox contains ${point.y}, the {point.y}which displays the Value Axis data in series labels. if user puts {point.x} it will reflect the Category Axis data in series labels.
Rotation: controls the rotation position of labels.
Font color: controls the font color of labels.
BackGround color: it gives the background color in series labels.
opacity: control the visibility of the series value labels.
Font size: control the font size of the series value labels.
Dashboard example of Series Value Labels Position:

