Value Axis > Value Axis Ticks

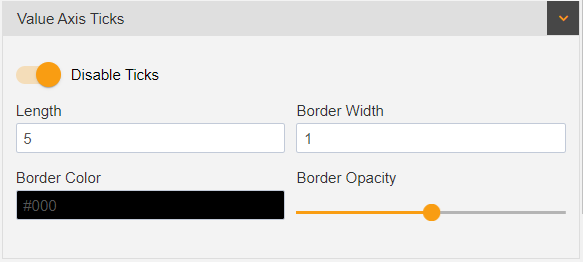
The Value Axis Ticks is enabled by default in charts.
The Border Width is used to set the width of ticks in chart.
Length controls the length of ticks.
Border Color changes the color of ticks as per user requirement.
Border Opacity controls the visibility of the ticks in charts.
