Adding Pivot to the Ad-hoc Reports in the AIVHUB application
In order to create pivot follow the following steps:-
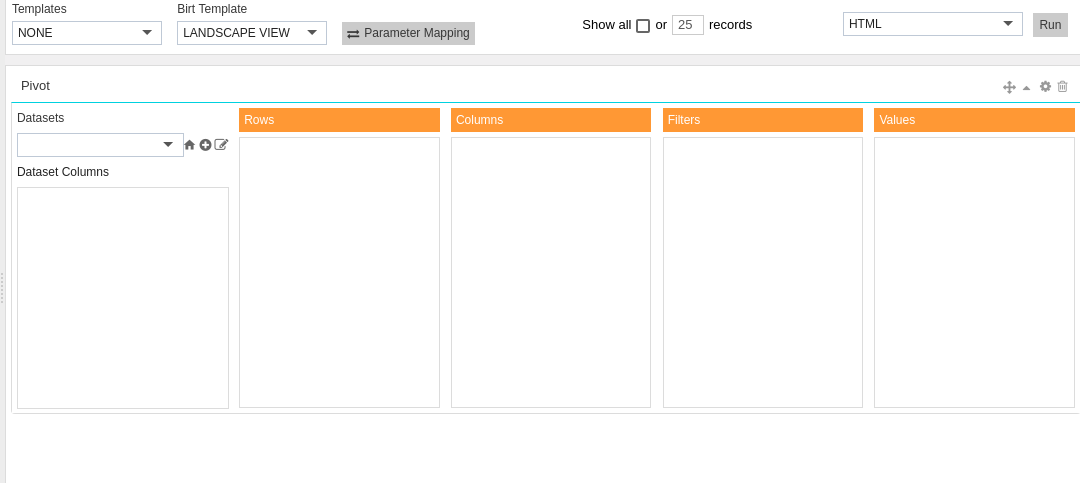
- Drag and drop the pivot to empty area as shown below:-
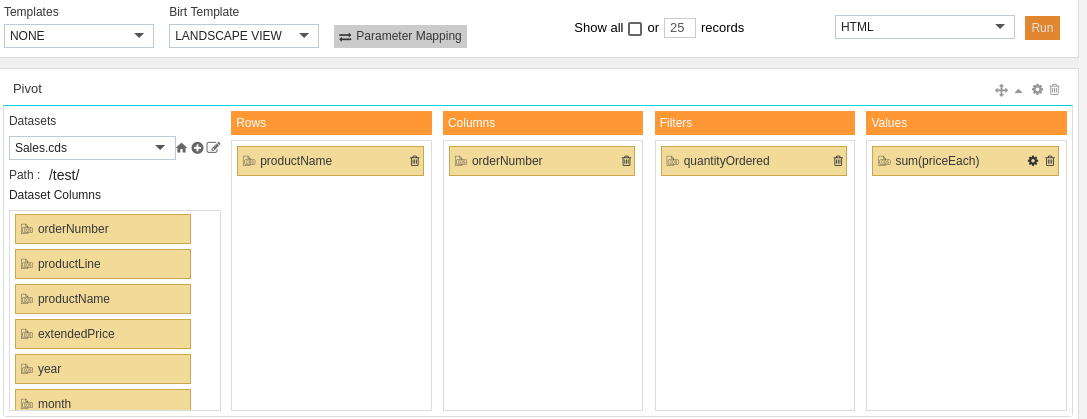
- Now from the drop down list of Datasets select the Sales.cds as follows:-
- You will see all the columns of the Dataset under Dataset Columns.
- Add productName, orderNumber, quantityOrdered and priceEach in Rows, Columns, Filters and values respectively as shown in above figure.
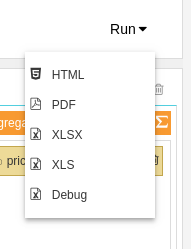
- For this example, we select Run as HTML.
- For this example, we select Run as HTML.
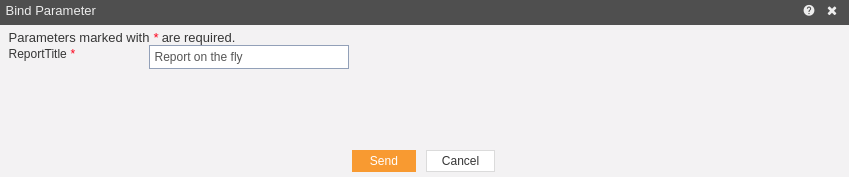
- Click on HTML which will open the following dialog box:-
- just click on Send.
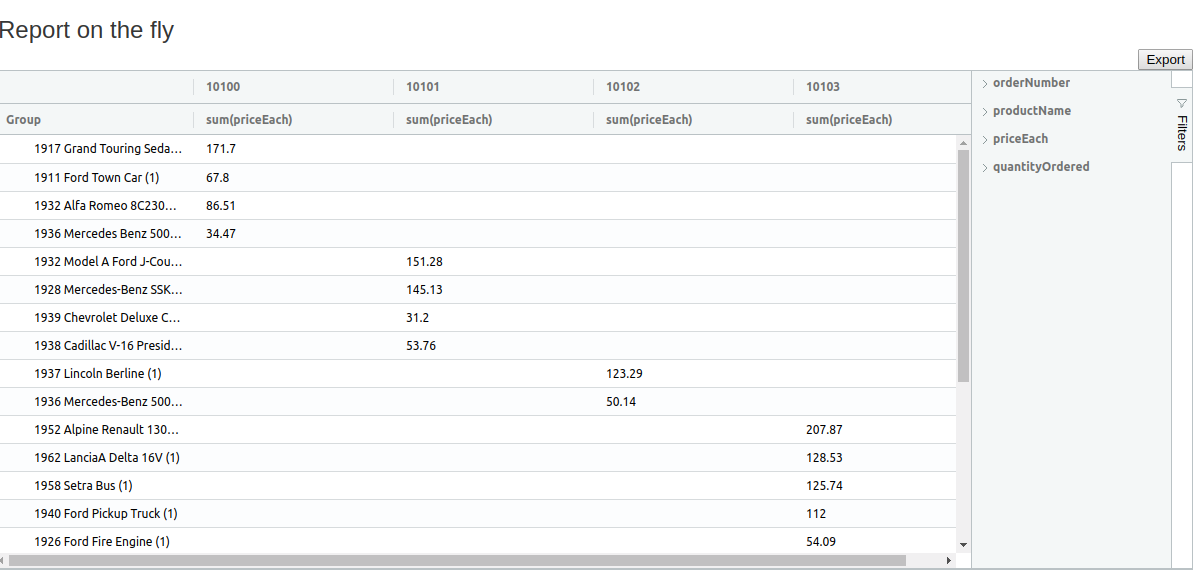
- The following pivot will be generated in HTML.
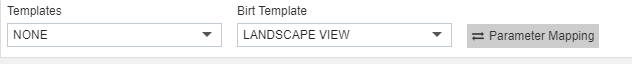
- You can change the template format from the BIRT Templates as follows:-
- You can also specify the number of records you want to show on a page from the following widget near the template selector widget:-