Dashboard Widgets

1. Click on hamburger icon.
2. Click on the (+) icon from dashboard Tab.
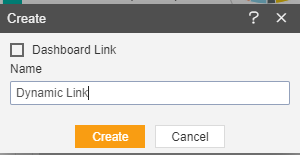
3. The Create Dashboard Dialog box will pop up on screen. Enter Dashboard Name as shown in Figure.
4. Click on Create After entering Dashboard Name in dialog box.
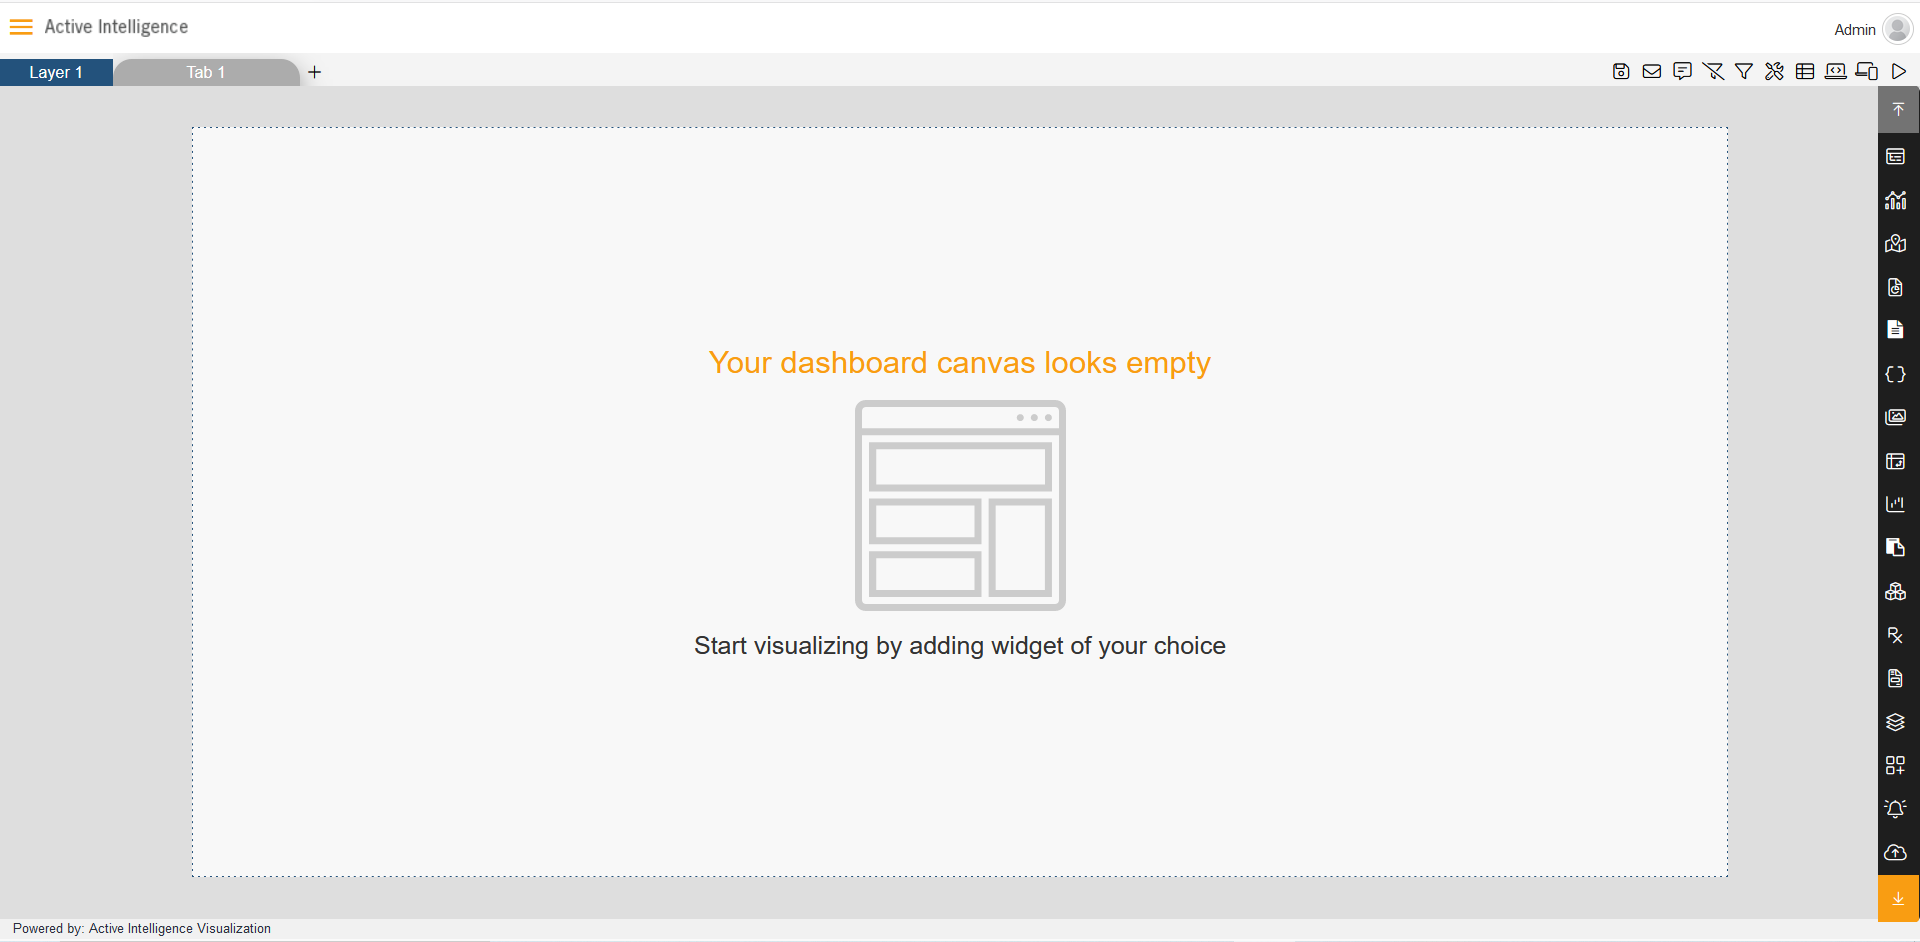
5. You will see an Empty Dashboard, As shown in figure below:
6. From Right Vertical Menu Select the Table Widget icon.
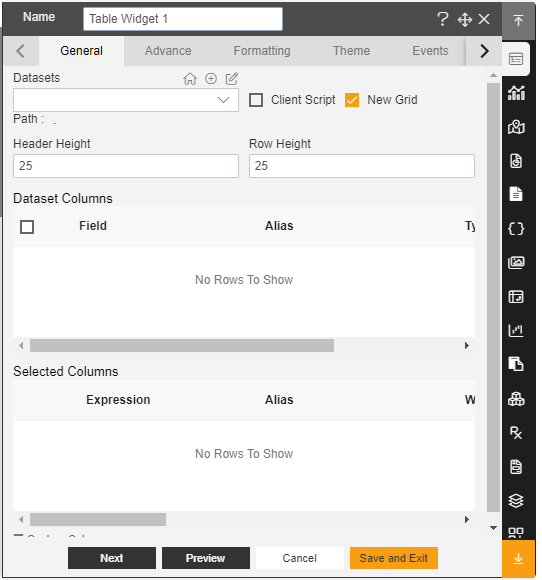
7. The Edit menu box appears as you click on Table Widget icon. And a widget gets added in content place automatically in dashboard, As shown in figure Below:
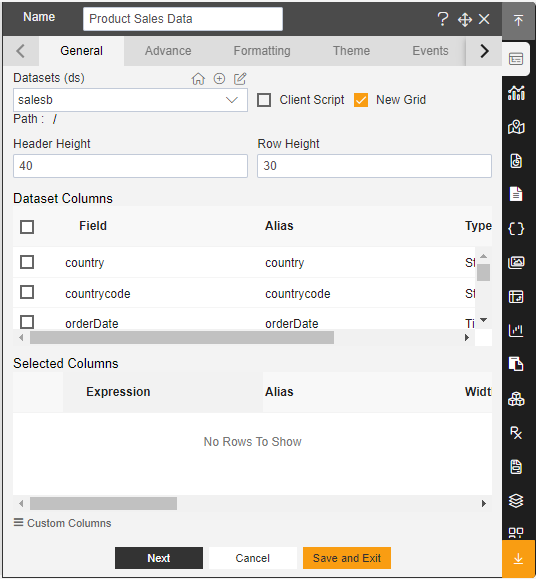
8. Enter Following details in chart controls:
Datasets: Salesb.ds
Header Height: 40
Row Height: 30
9. Fill above details in edit box, As Shown in figure:
10. Click on Preview and Save and Exit.
11. From Right Vertical Menu Select the chart Widget icon.
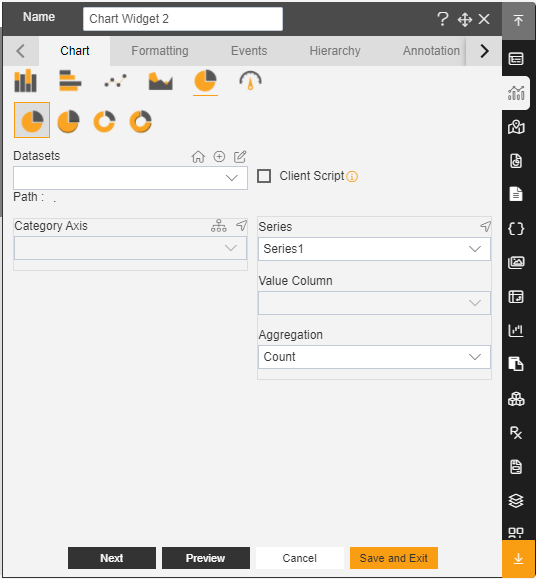
12. The Edit menu box appears as you click on Chart Widget icon. And a widget gets added in content place automatically in dashboard.
13. In Chart Widget Select Pie & Donut chart and click on Pie Chart, As shown in Figure Below:
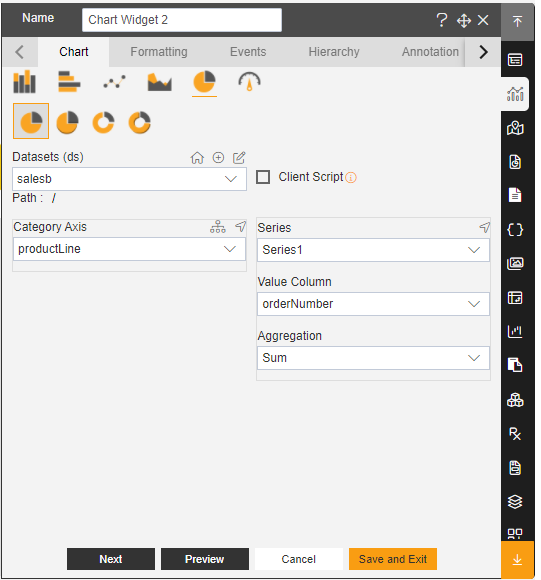
14. Enter Following details in chart controls:
Datasets: Salesb.ds
Category Axis: ProductLine
Value Column: OrderNumber
Aggregation: Sum
15. Fill above details in edit box, As Shown in figure:
16. Click on Preview and Save and Exit.
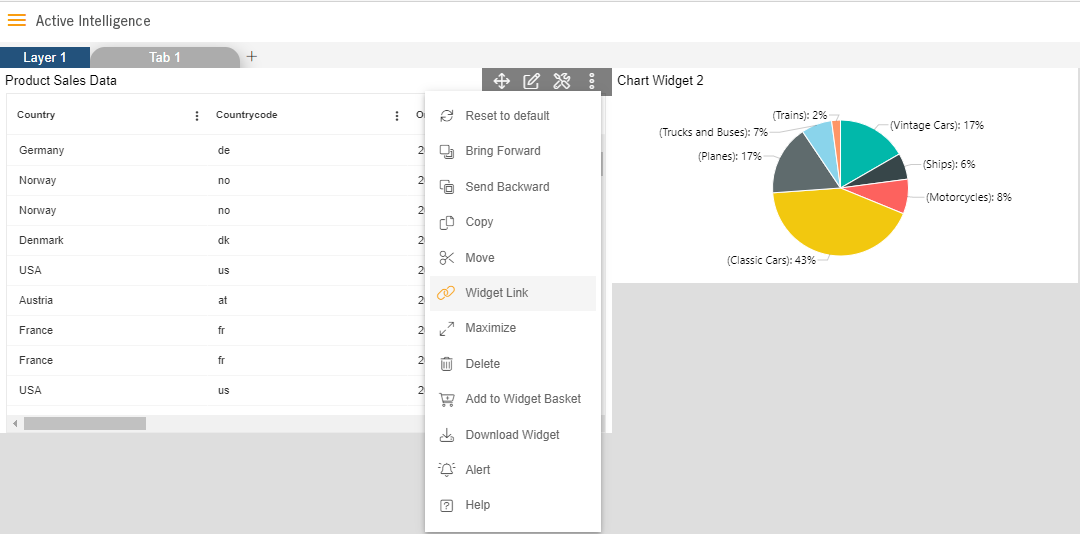
17. Click on the side ellipsis in your table widget and Select Widget Link As shown in Figure Below:
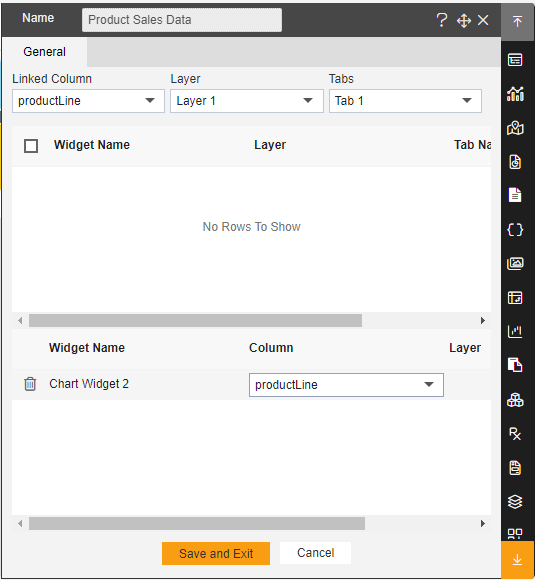
18. Enter Following details in Widget Link: Linked Column: ProductLine Layer: Layer1 Tab: Tab1 Chart Widget: ProductLine
19. Fill above details in edit box, As Shown in figure:
20. Click on Save and Exit.
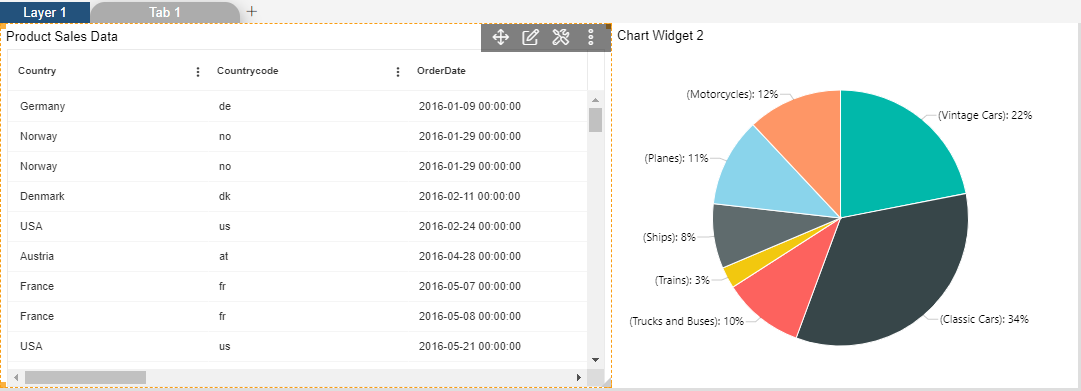
21. Now, match your Dynamic Link with the below example, it should look like the figure below: