Multi-layer Widget

1. Click on hamburger icon.
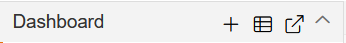
2. Click on the (+) icon from Visualization Tab.
3. The Create Dashboard Dialog Box will pop up on Screen Enter Dashboard Name as Shown in figure.
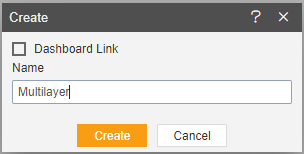
4. Click on Create after entering Dashboard Name in Dialog Box.
5. You will see an Empty Dashboard as Shown in Figure.
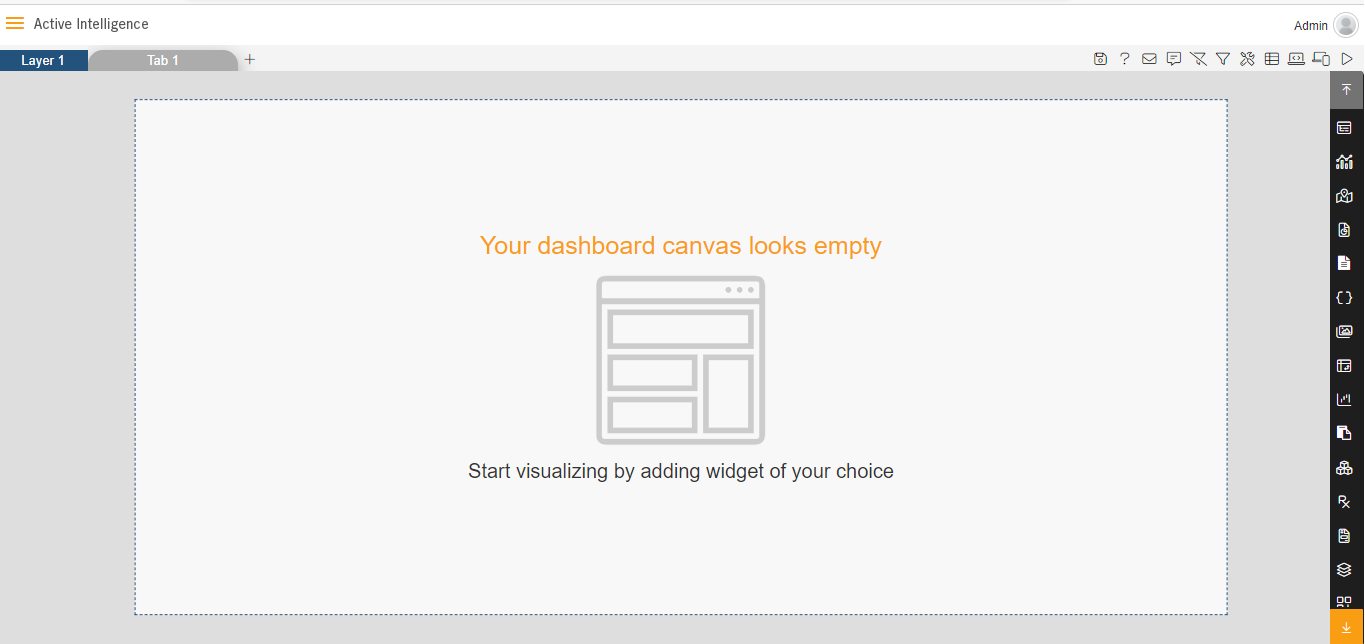
6. From the right Vertical menu Select the Table Widget Icon.
7. The edit menu box appears as you click on Table Widget Icon And a widget gets added in content place automatically in dashboard, As shown in figure below:
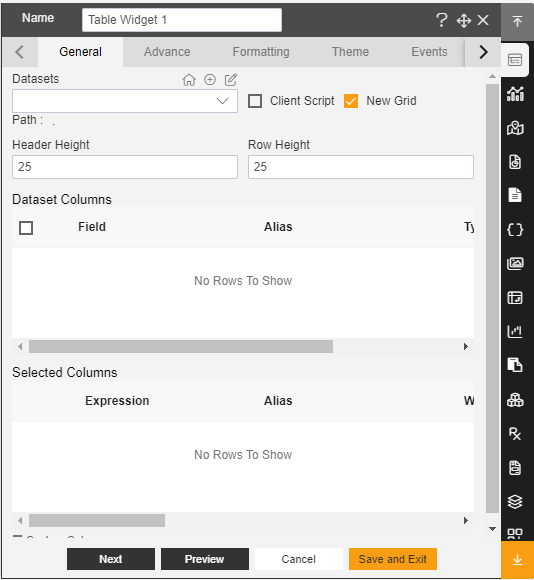
8. Enter Following details in General:
Dataset: Salesb.ds
Header Height: 25
Row Height: 25
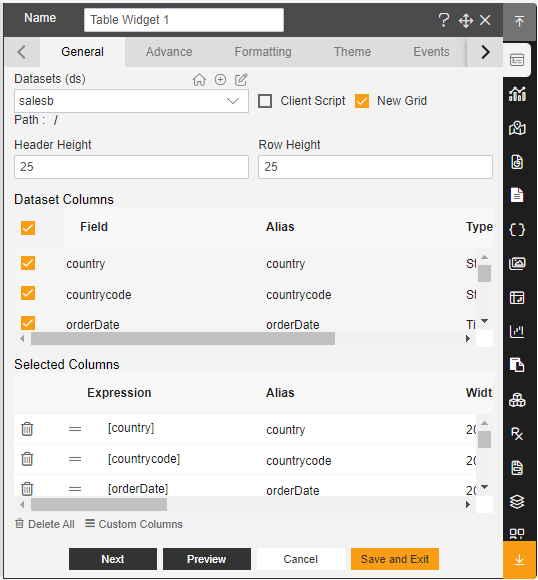
In the Dataset Column Select All checkbox.
9. Fill above details in edit box as shown in figure below:
10. From the right Vertical menu Select the Chart Widget icon.
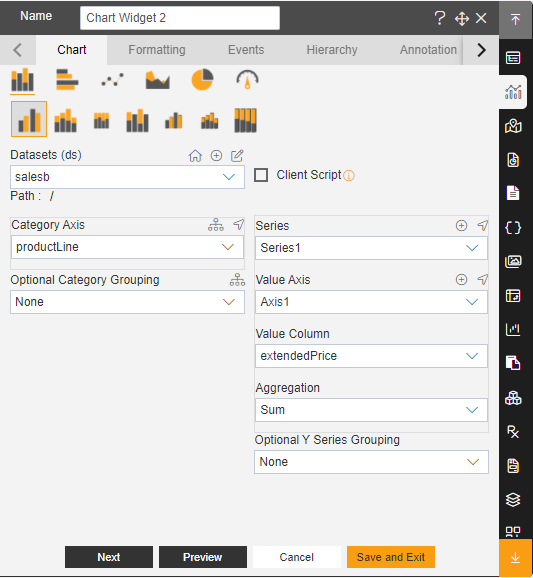
11. The edit menu box appears as you click on the Chart Widget icon and a widget gets added in the content place automatically in the dashboard.
12. Enter Following details in Chart Property:
Dataset: salesb.ds
Category Axis: Product Line
Value Column: extended price
aggregation: Sum
13. Fill above details in edit box as shown in figure below:
14. Click on Preview and Save and Exit.
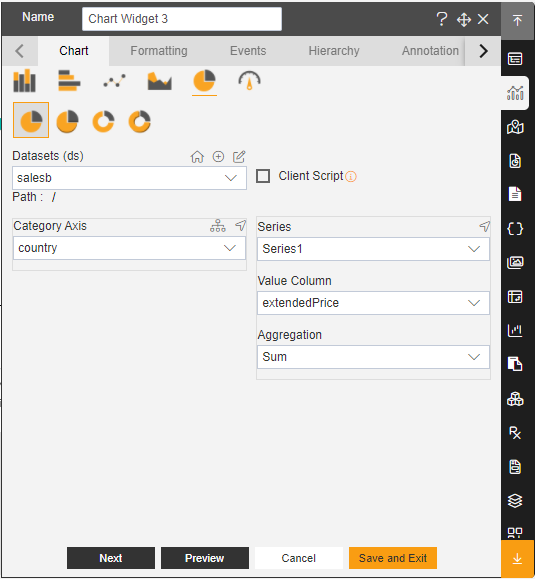
15. From the right Vertical menu Select the Chart Widget Icon In that select the Pie and Donut Chart, As shown in figure below:
16. The edit menu box appears as you click on Chart Widget Icon And a widget gets added in the content place automatically in the dashboard.

17. Enter Following details in Chart Property:
Dataset: salesb.ds
Category Axis: Country
Value Column: extendedprice
aggregation: Sum
18. Fill above details in edit box as shown in figure below:
19. Click on Preview and Save and Exit.
20. From the right Vertical menu Select the Card Widget Icon, As shown in figure below:
21.The edit menu box appears as you click on Card Widget Icon And a widget gets added in the content place automatically in the dashboard.
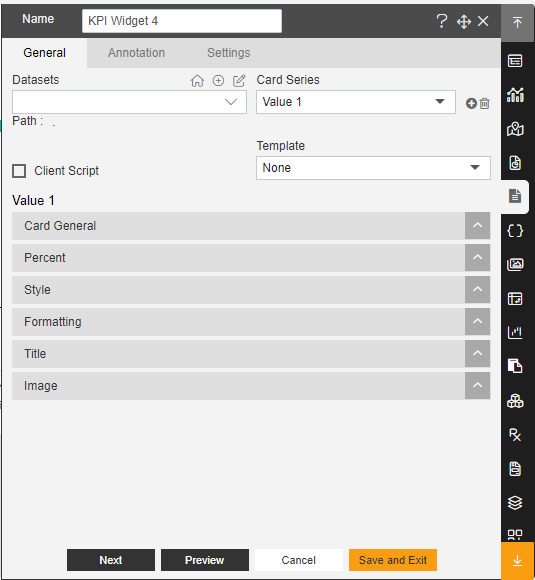
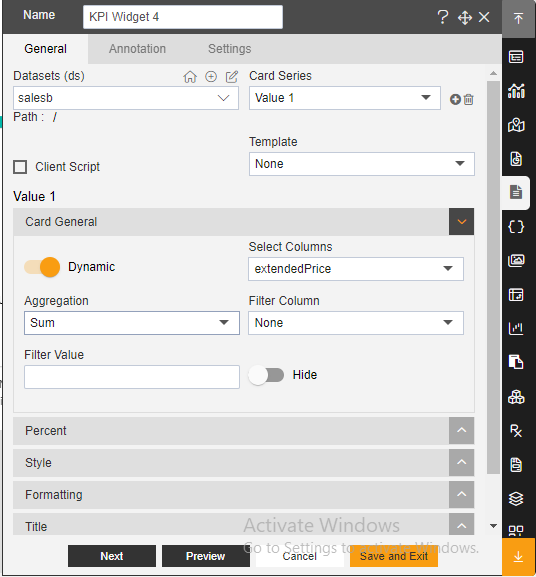
22. Enter Following details in Chart Property:
Dataset: sales.ds
Category Axis: Country
Selected Column: extendedprice
aggregation: Sum
23. Fill above details in edit box as shown in figure below:
24. Click on Preview and Save and Exit.
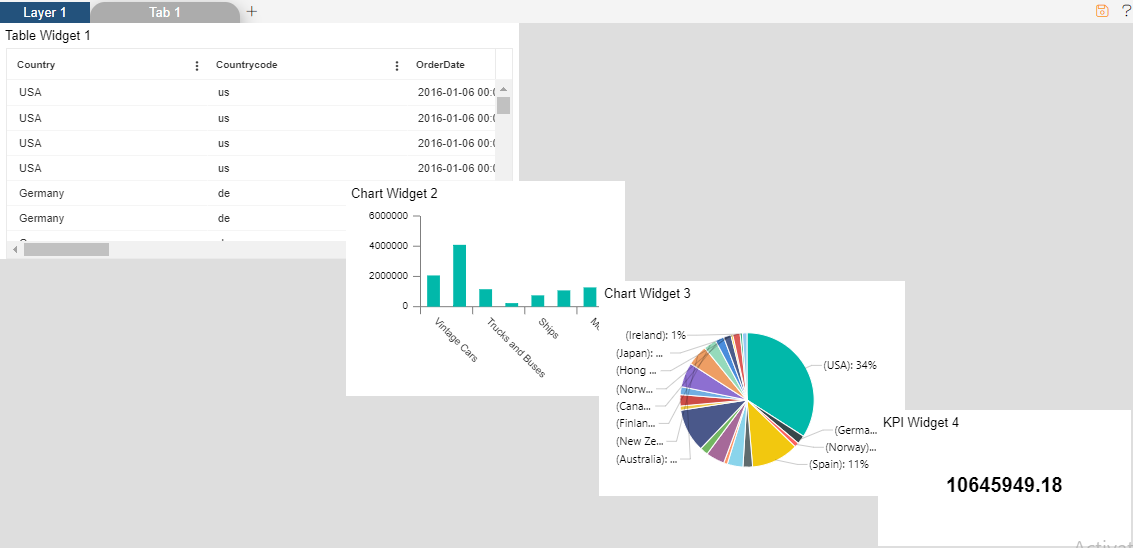
25. In Vertical ellipses select the Bring Forward and move the widgets.
26. Now match your chart with below example as shown in figure below: