Create DML Right Join Dataset
Follow steps to create DML dataset in AIV:-
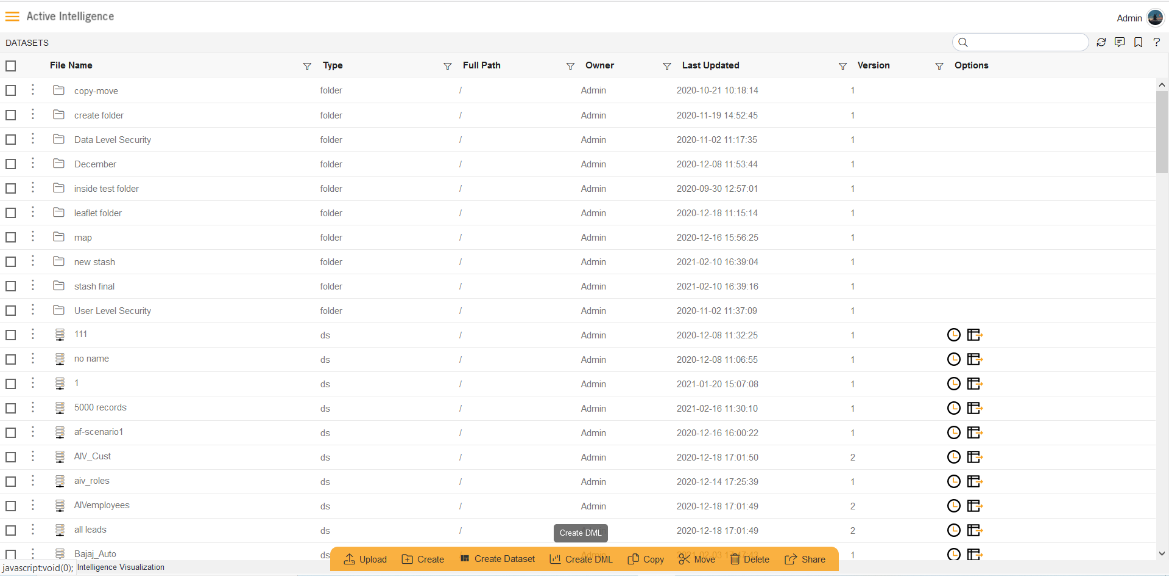
1. Go to Dataset section, Click on Create DML from bottom menu bar. As shown in figure below:
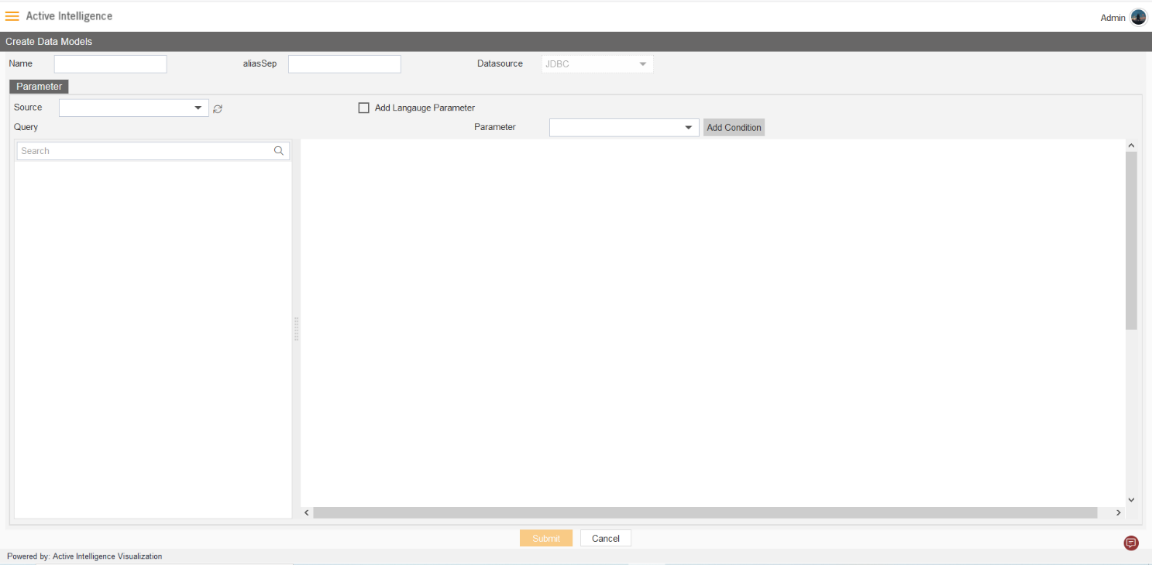
2. The Create Data Module dialog box looks as shown in figure below:
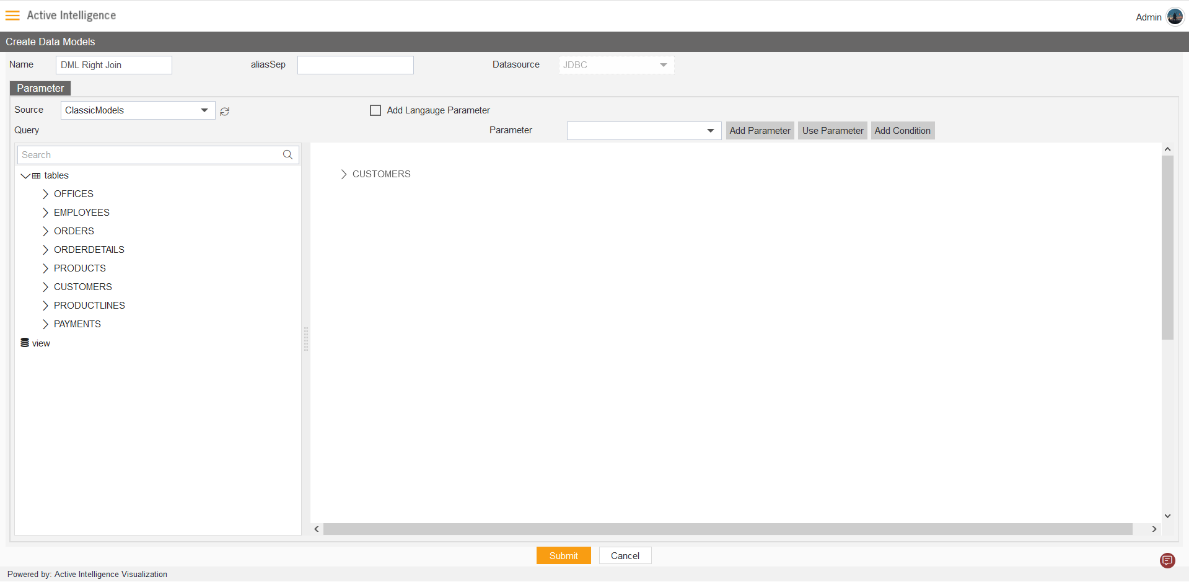
3. Enter Following detail in DML Module dialog box:
Name: DML Right Join
Source: ClassicModels
Expend tables from left side table view, As shown in figure below:
4. Drag and Drop the CUSTOMERS table from the Table list to Right side diagram box, then select all the columns of CUSTOMERS table, click on submit button.
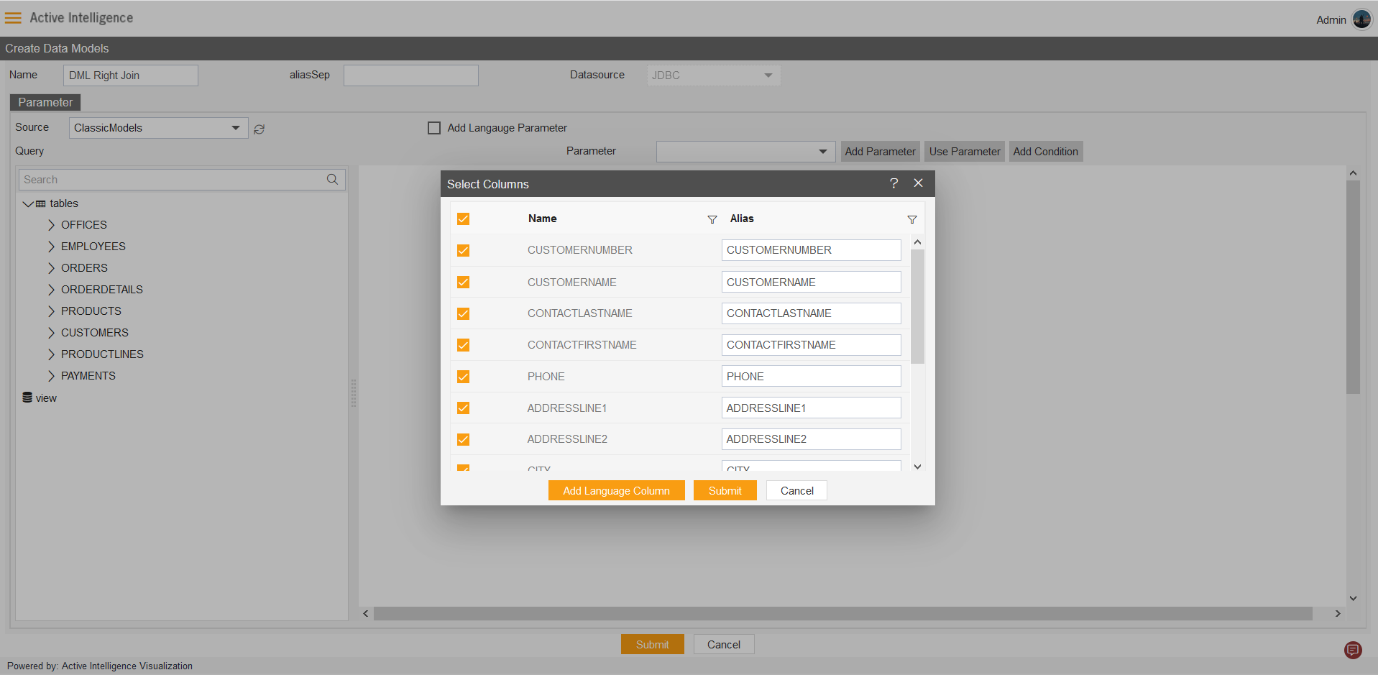
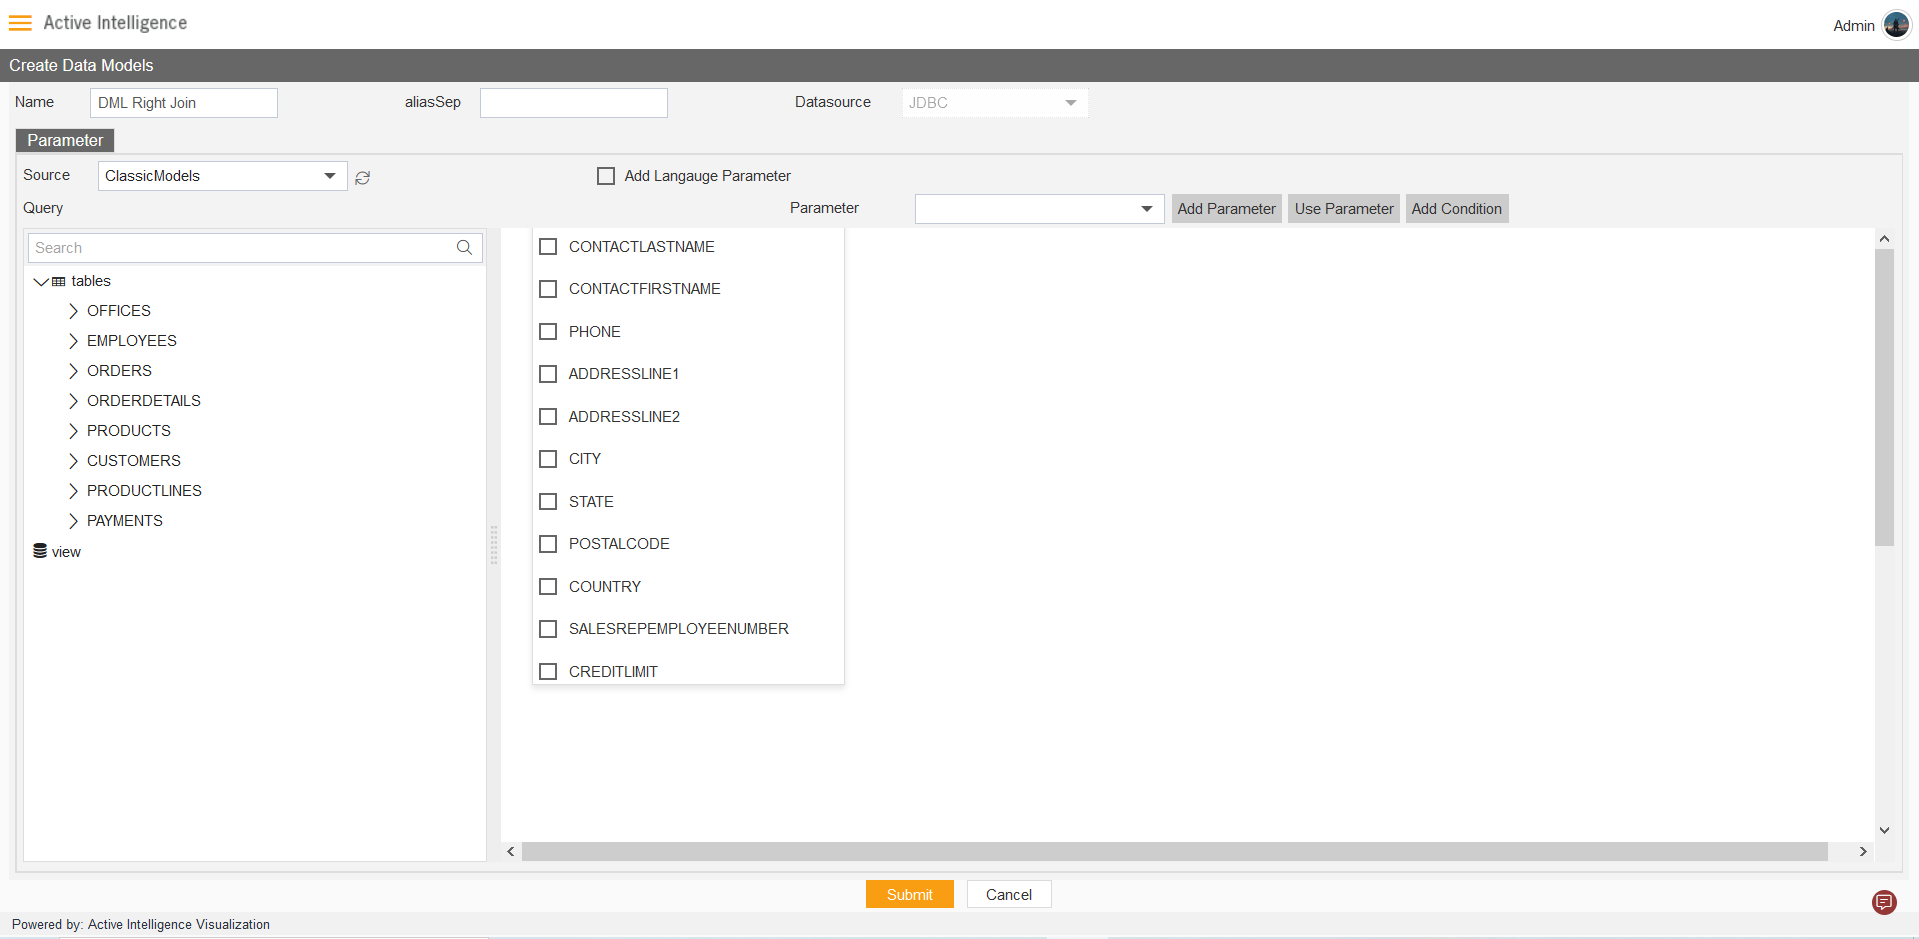
5. After submitting, the diagram box will look like the figure below:
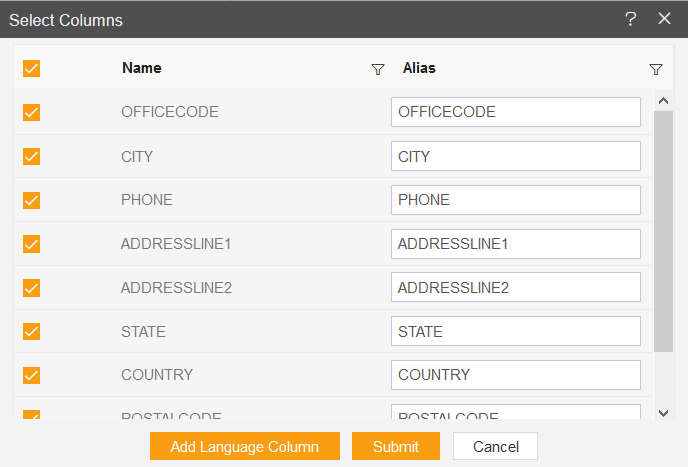
6. Drag and drop the OFFICES from the left table menu to right diagram box. as shown in figure below:

7. Select all the column from OFFICES table, and click submit button.
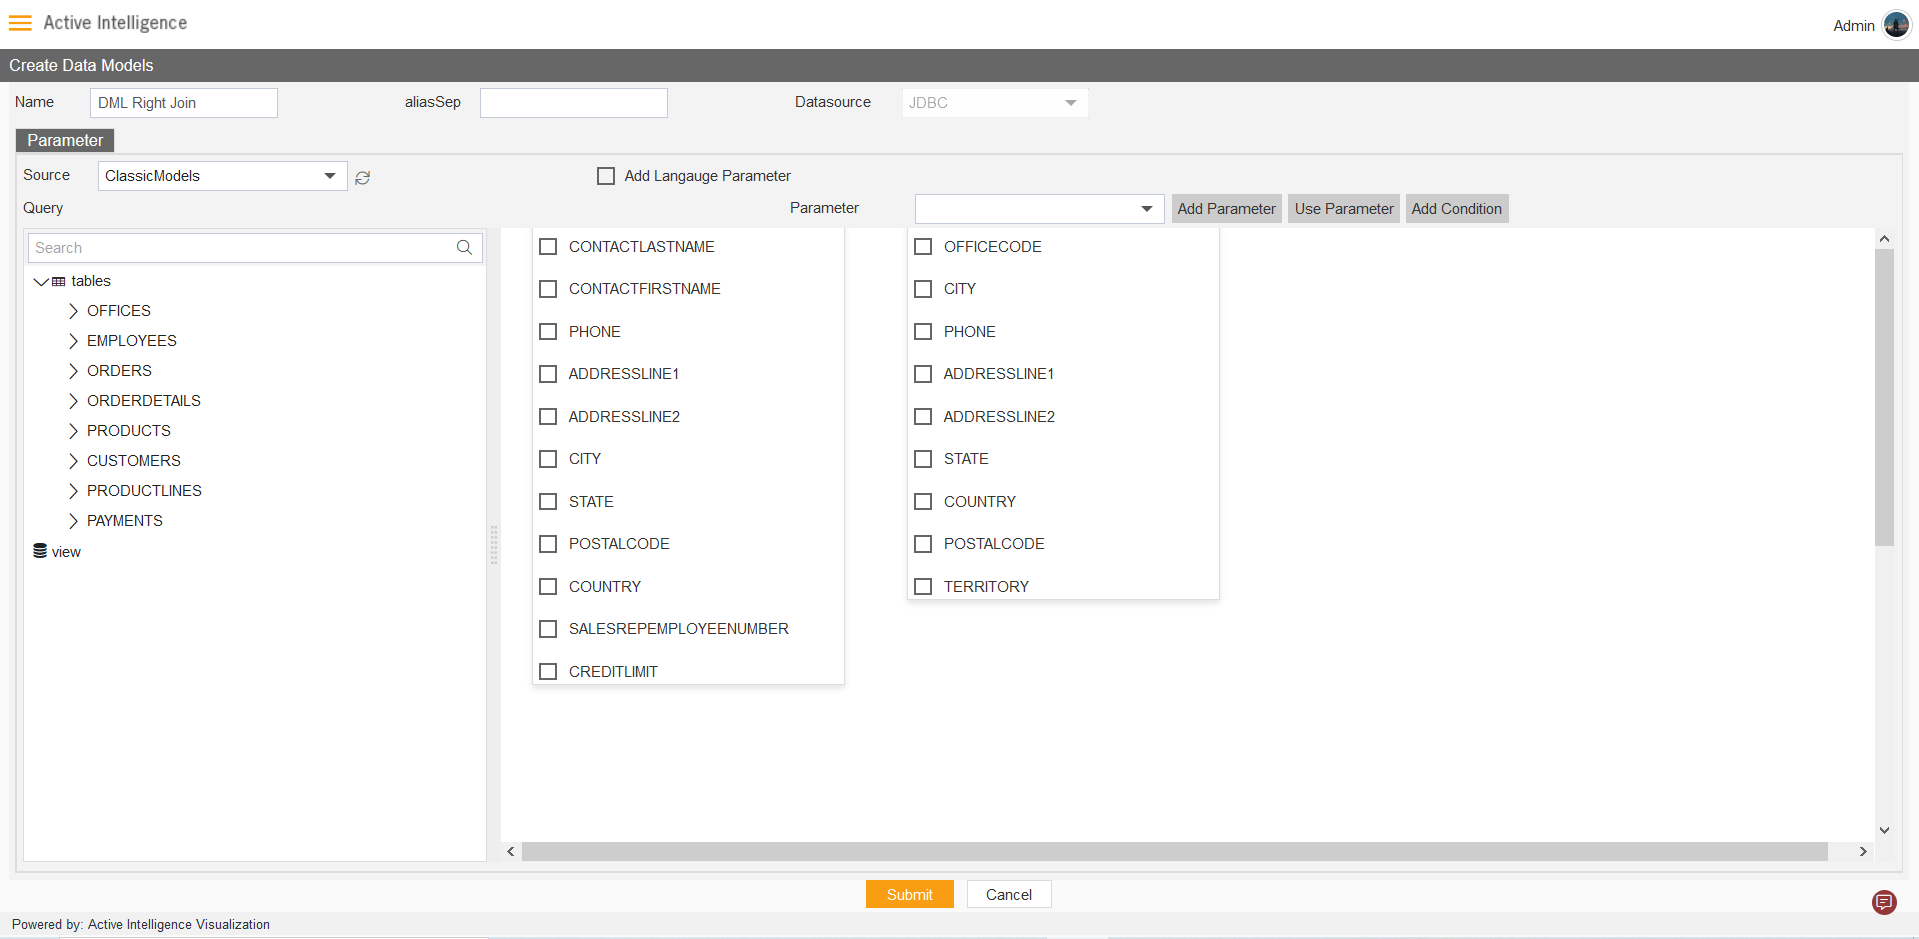
8. After adding CUSTOMERS and OFFICES from the table list, the diagram box looks like the figure below:
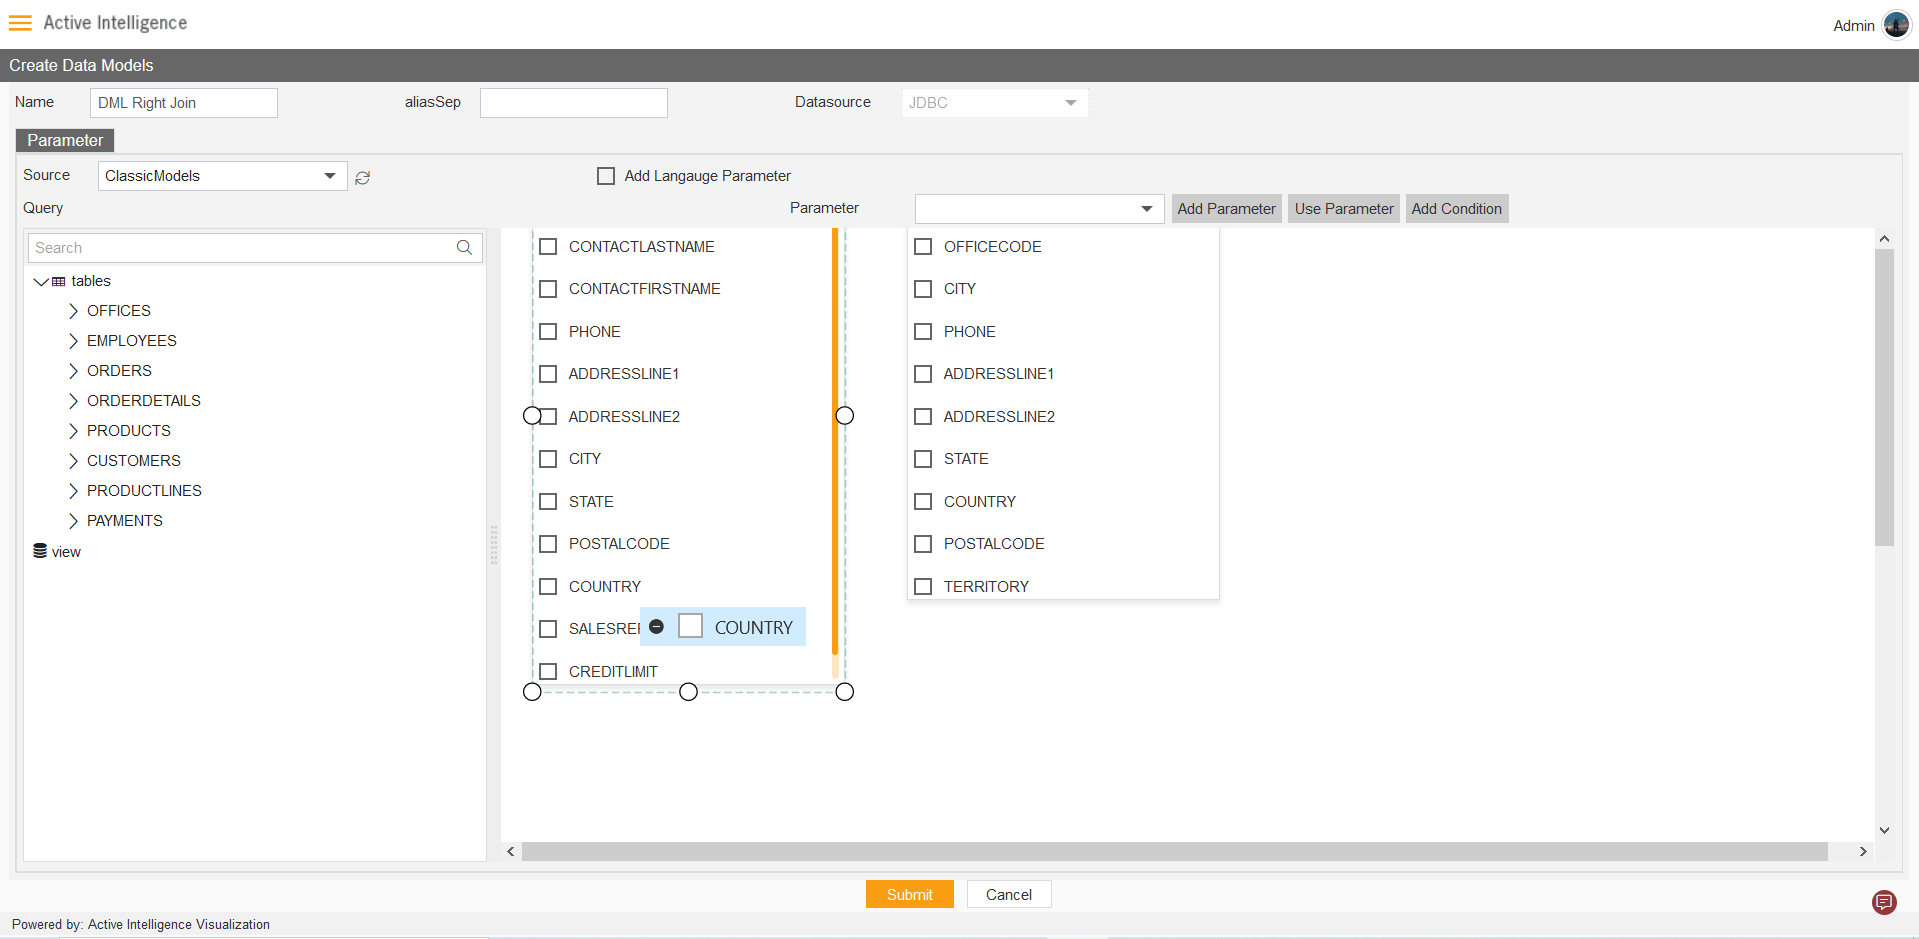
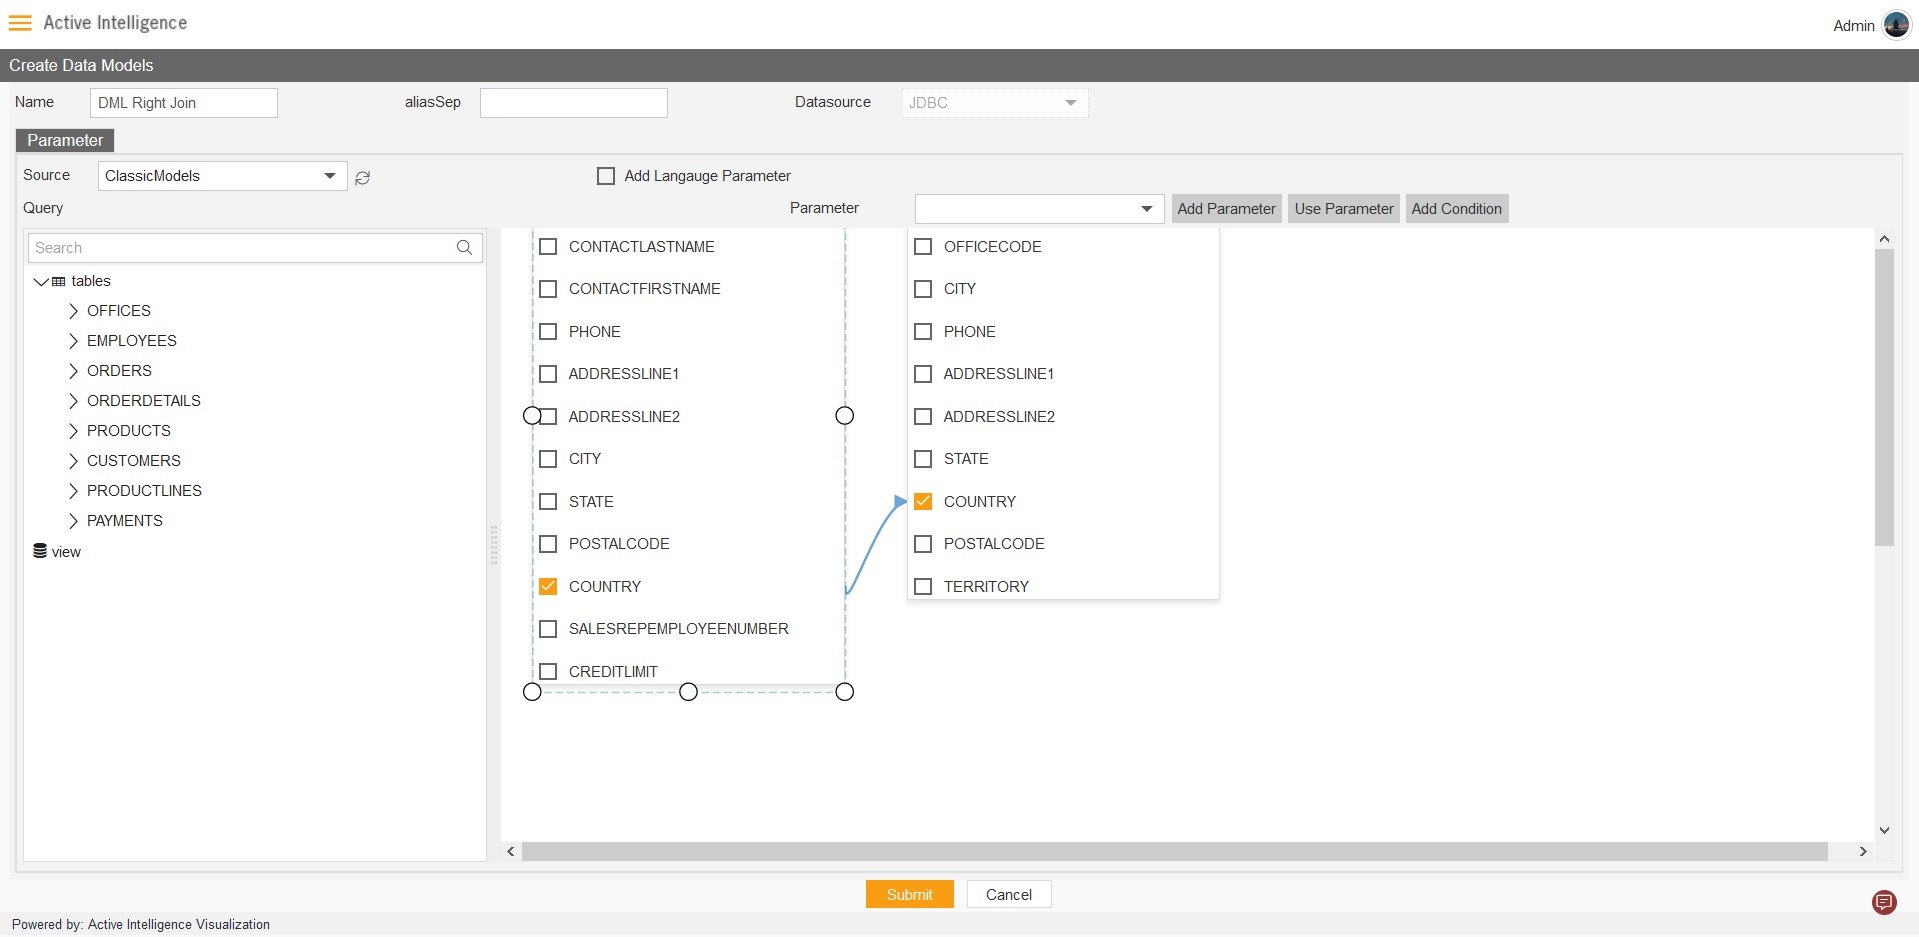
9. Drag the COUNTRY column from Customers to Offices.
10. Click on the thread between two tables, to add DML configuration.
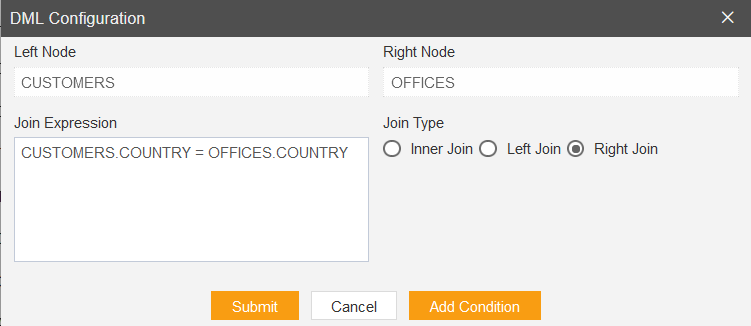
11. The DML configuration control box will open, Select the Right Join radio button and click on Submit button, as shown in figure below:
12. The Connection between two tables will looks as shown in figure below:
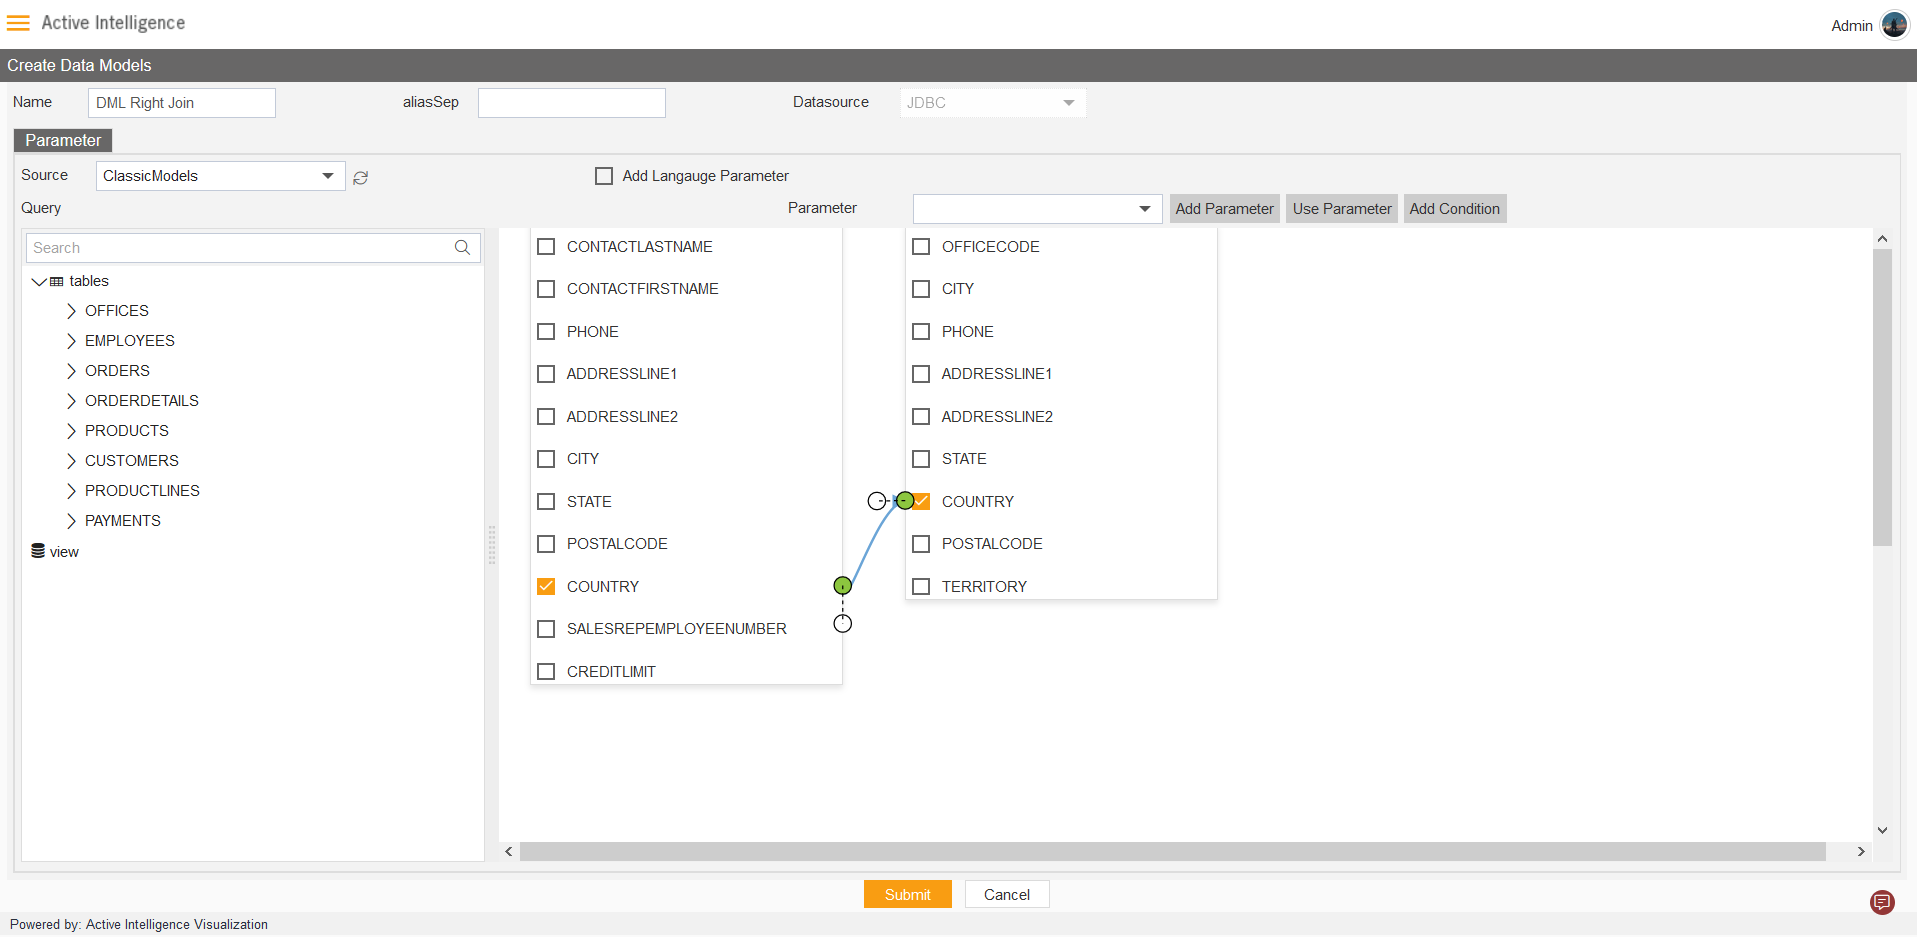
Note: Click on Submit to save the dataset.
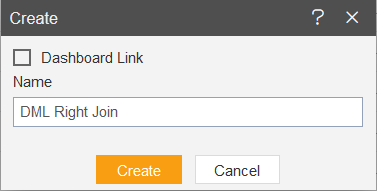
13. Create Dashboard from the Visualization section. Example name: DML Right Join, as shown in figure below:
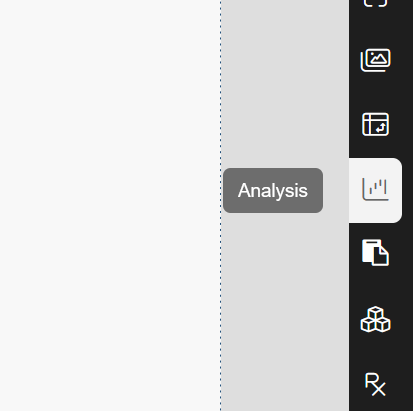
14. After loading the Dashboard, Find Analysis Icon from the left vertical menu bar, click on the icon to load analysis widget in dashboard.
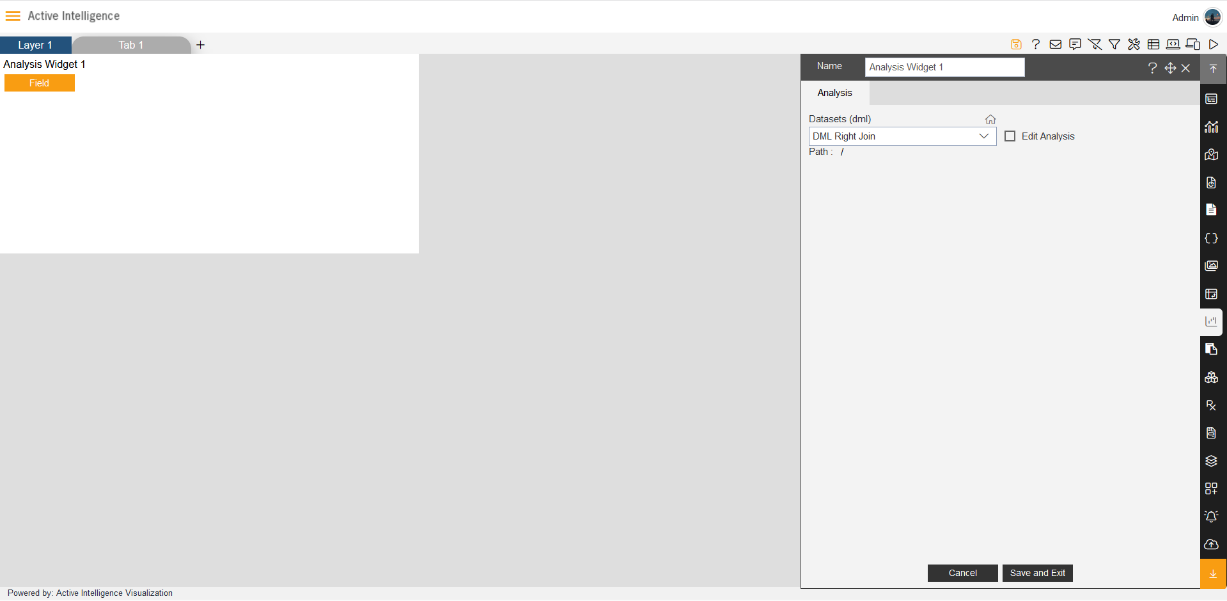
15. The Analysis widget will get load in dashboard automatically after clicking on the analysis icon. > Select the Dataset(dml): DML Right Join.
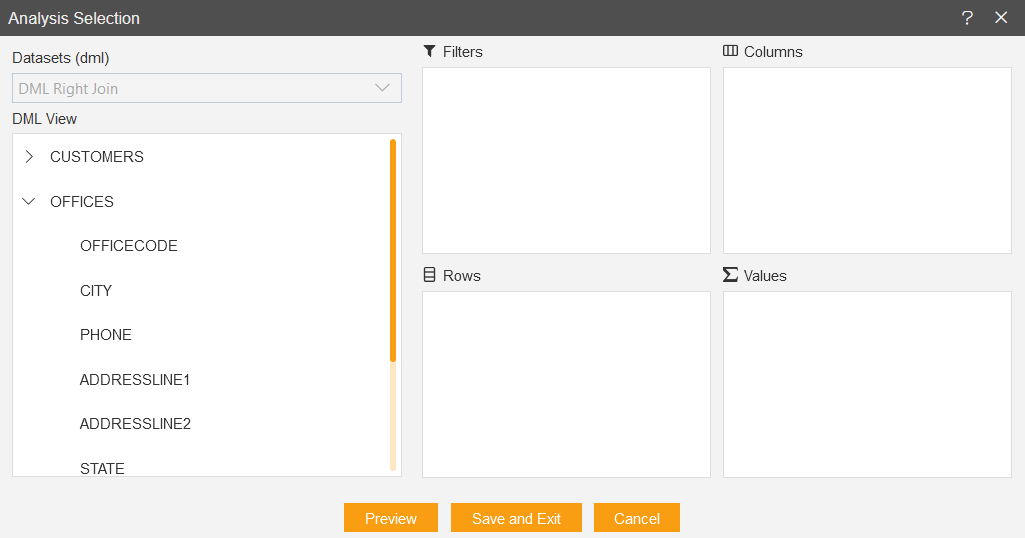
16. Click on Field icon from Analysis widget, then the Analysis Selection dialog box will open, as shown in figure below:
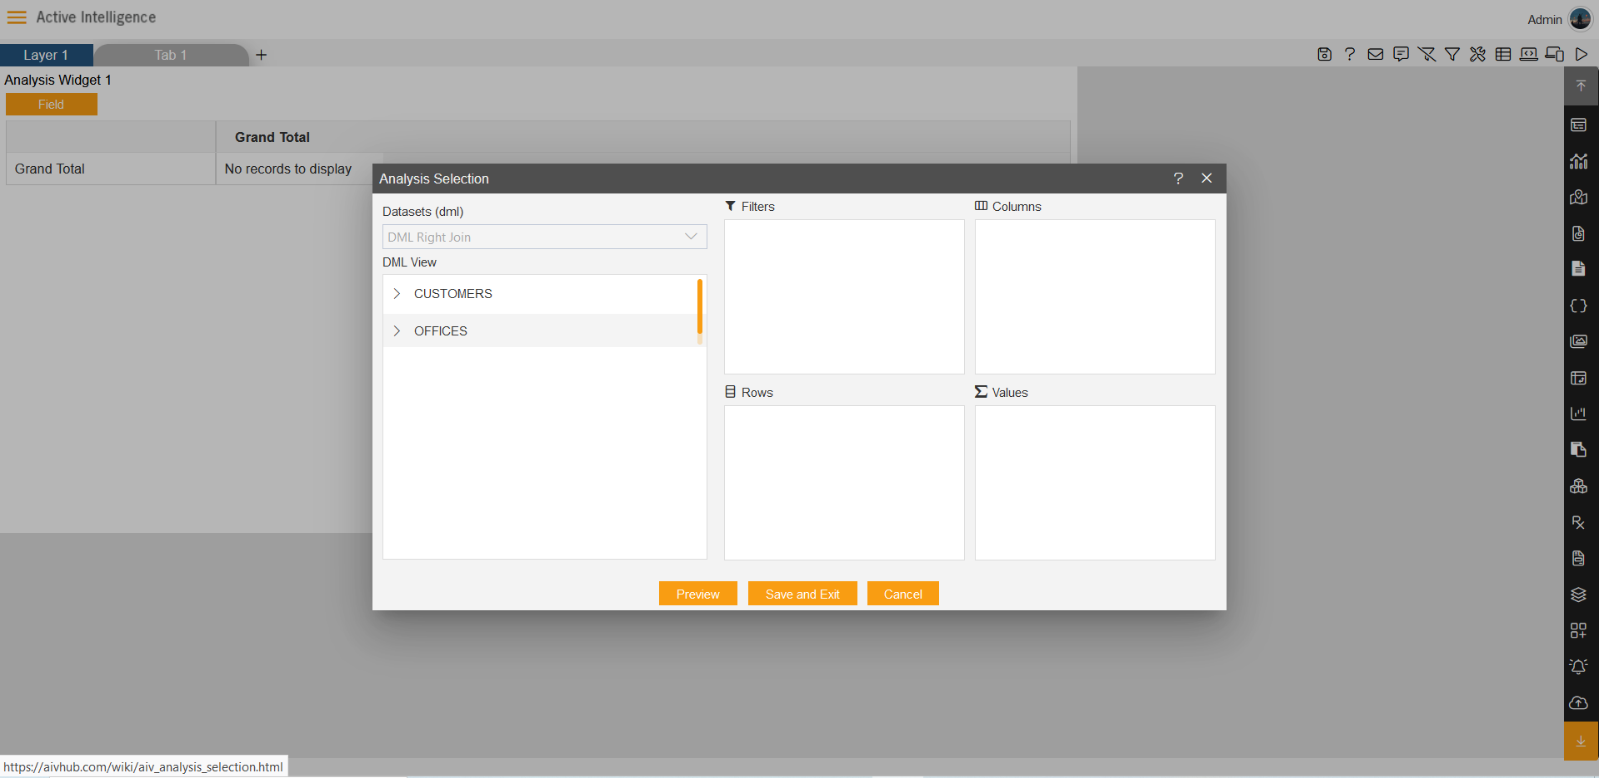
17. The two table will get load the left side box of DML view, Now expends the OFFICES table.
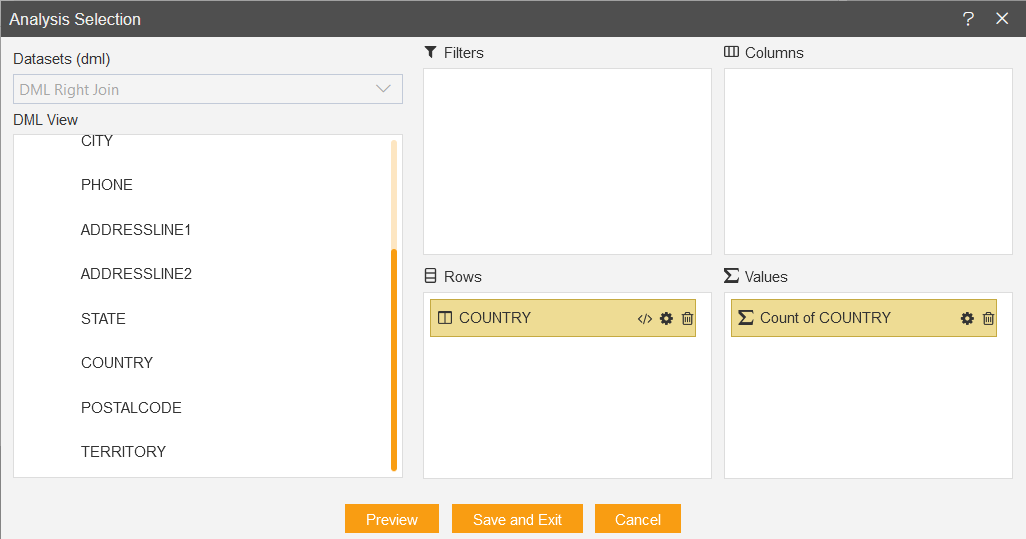
18. Drag and drop Country column in the Rows box, the Values box will take the Count of Country automatically as you drag the country in Rows click on the Save to see the reflection of the selected data in widget.
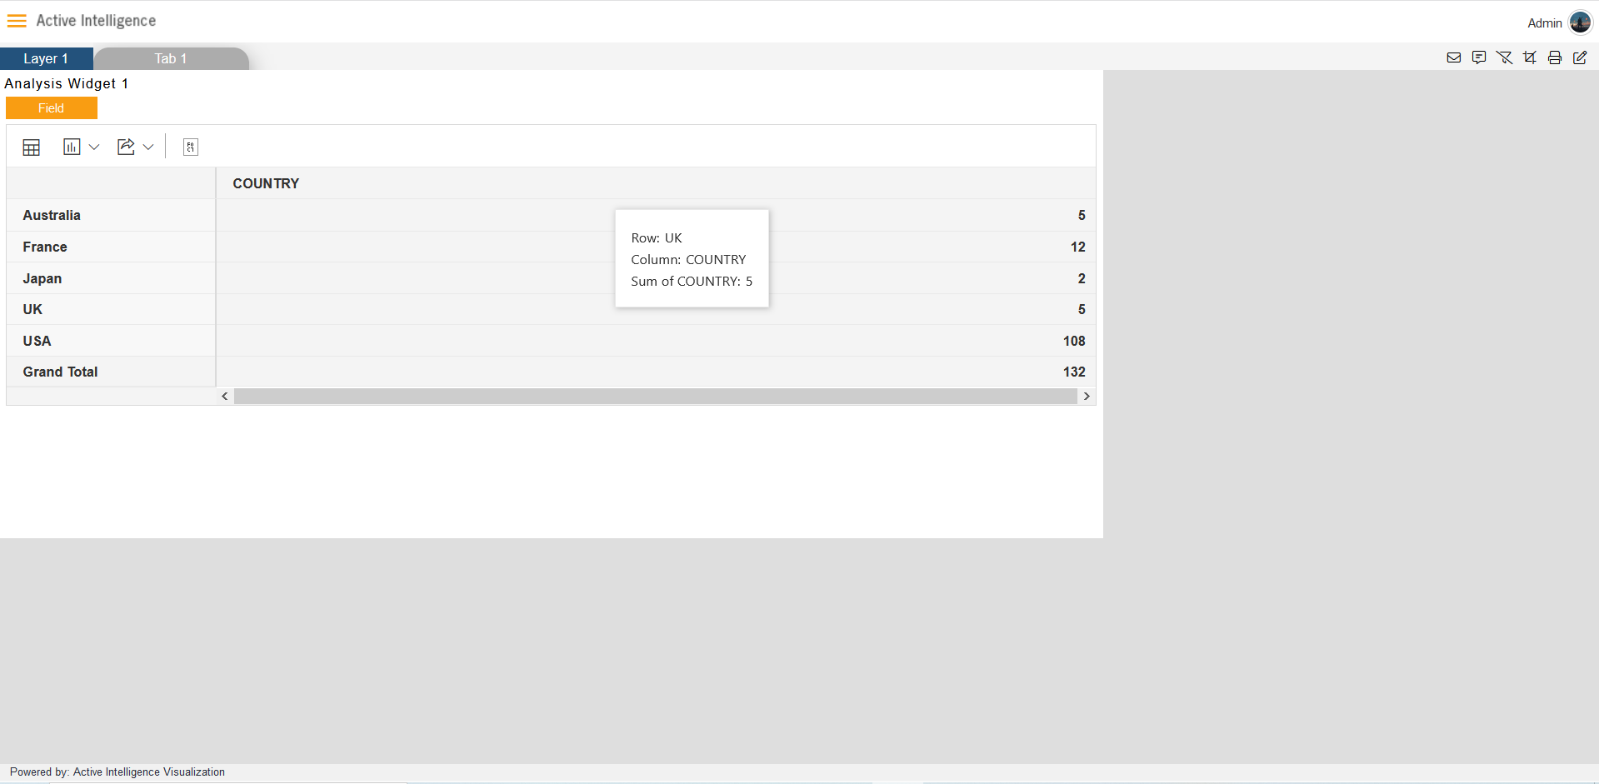
19. The output of the widget will look like available figure below: