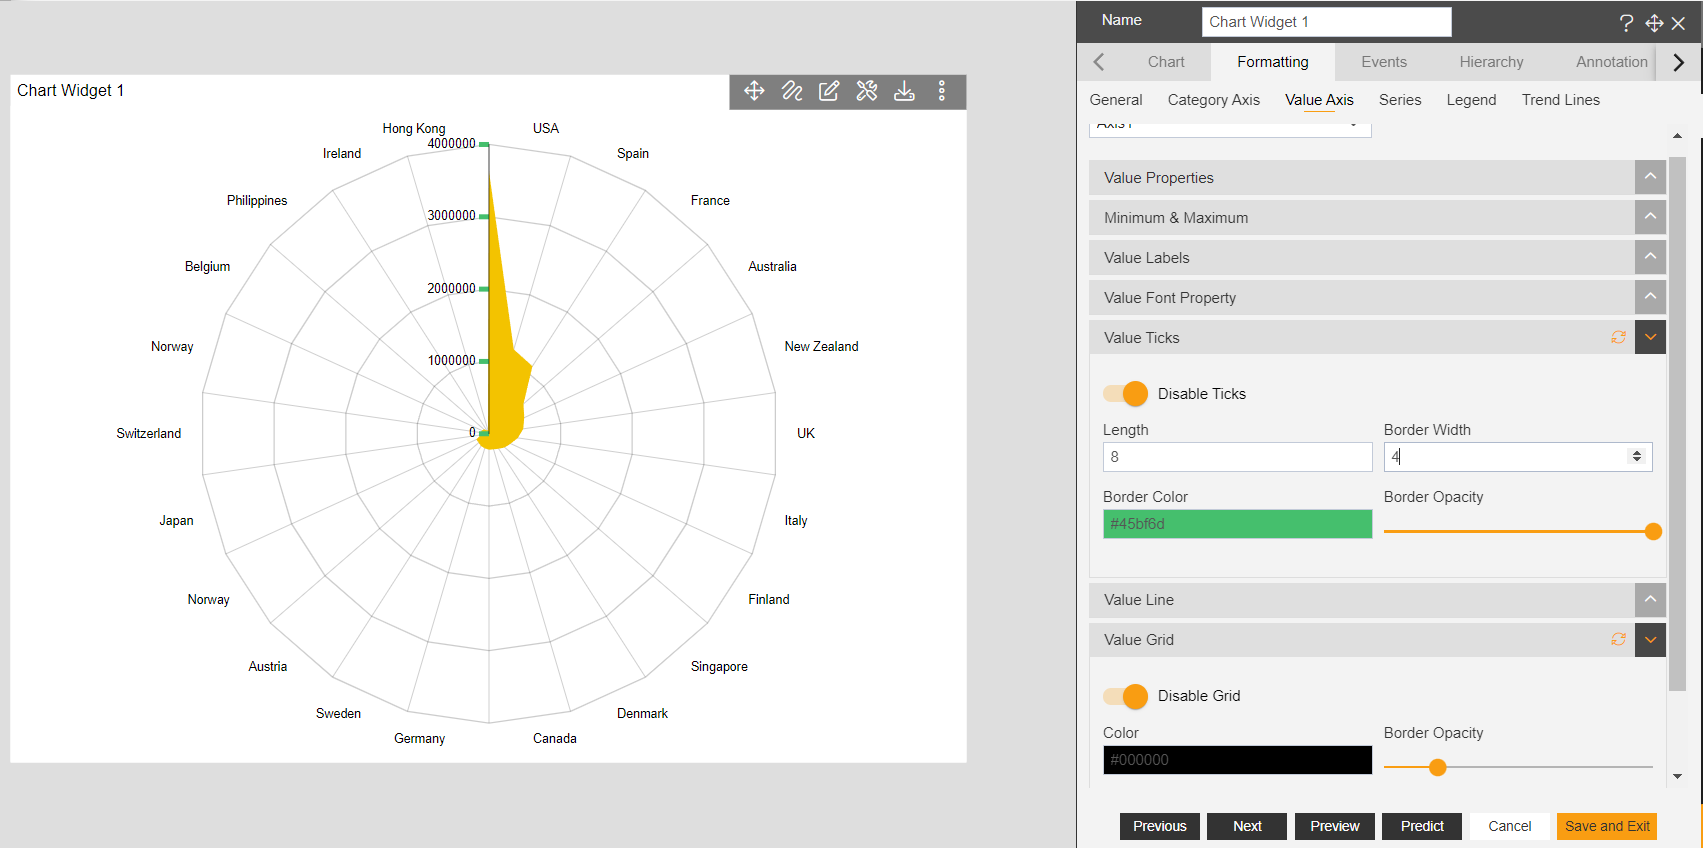
Radar chart > Value Ticks
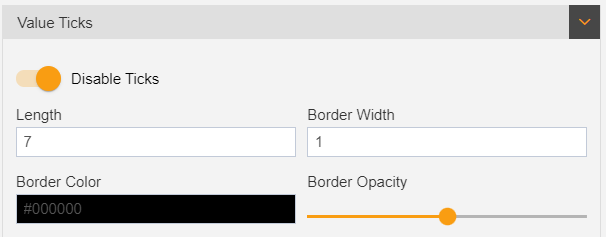
• Value Ticks – used to show the ticks on the radar chart.
• Go to Edit Menu > Formatting tab > Value Axis > Value Ticks
1. Value Ticks are enable as default.
2. Length – by using this option user can set the length of Ticks on Value Axis.
3. Border Width – by using this user can make the changes on the width of Value Ticks.
4. Border Color – used to set the color of value ticks. User can select any color from the color palette.
5. Border Opacity – user can set the visibility of the value ticks.