Radar chart > Bullets
1. In Formatting Property click on Series Property.
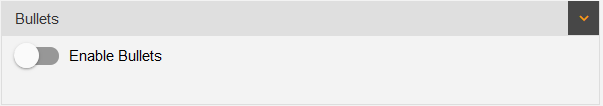
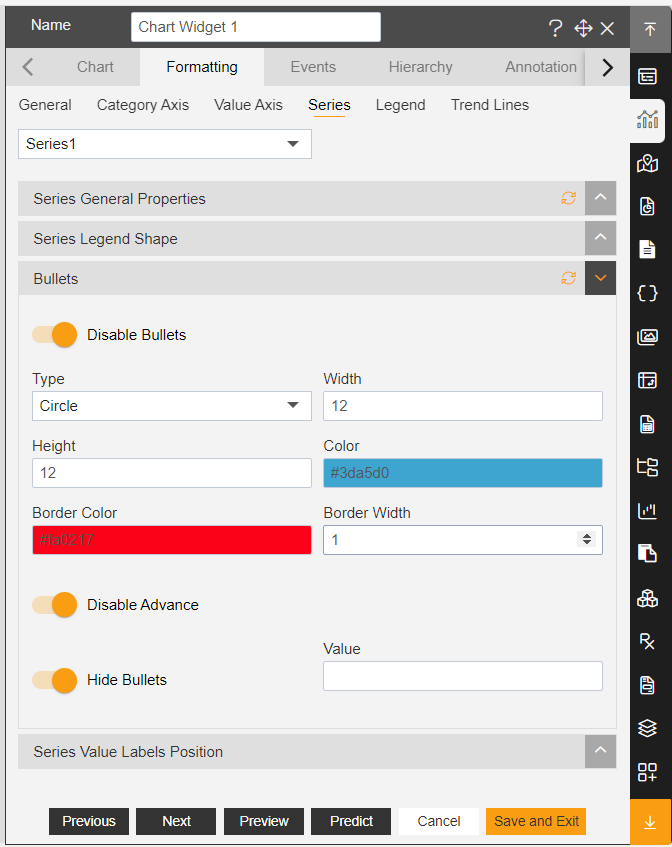
2. To add bullets in chart, click on the bullets option in series, then click on the toggle button to enable bullets.
3. As you enable the Bullets, the control functions will appear as shown in the figure below:
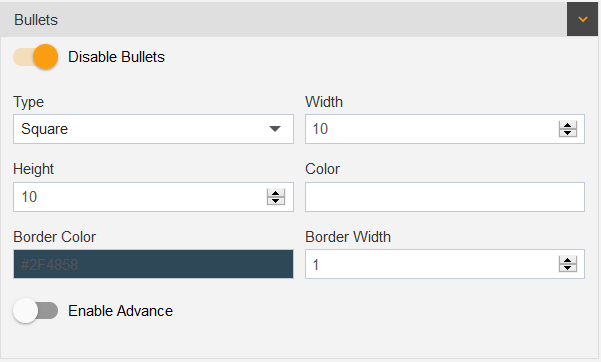
Width: To make changes to the bullet width in chart.
Height: To make changes to the bullet height in chart.
Color: To make changes to the bullet color in chart.
Border Color: To make changes to the color of the bullet border in chart.
Border width: To make changes to the width of the border of the bullet in chart.
4. Once the user enables the advance option of bullet, the options appear as shown in the figure below:
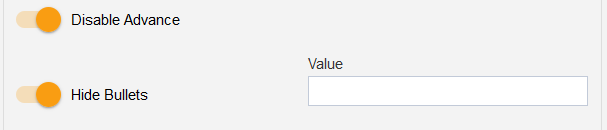
Value: To indicate the bullets at required values in chart.
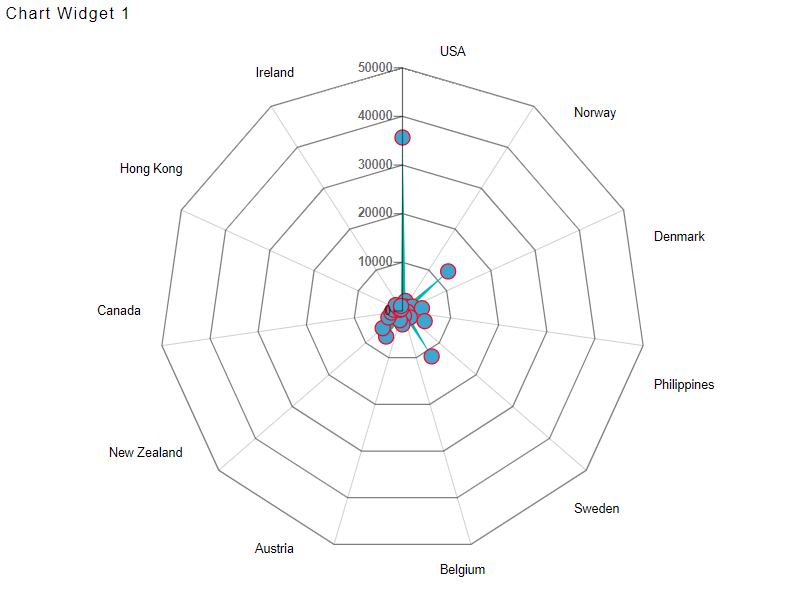
5. Enter following details in Bullets:
Type: Circle
Width: 12
Height: 12
Color: #3da5d0
Border Color: #fa0217
Border Width: 1
Toggle Advance
6. Fill above details, As shown in figure below:
7. Click on Preview and Save and Exit.
8. Now, match your Radar chart with the below example, it should look like the figure below: