Radar chart > Value Properties
• Category Font Property – used to make changes in the value axis data.
Go to Edit Menu > Formatting tab > Value Axis > Value Properties.
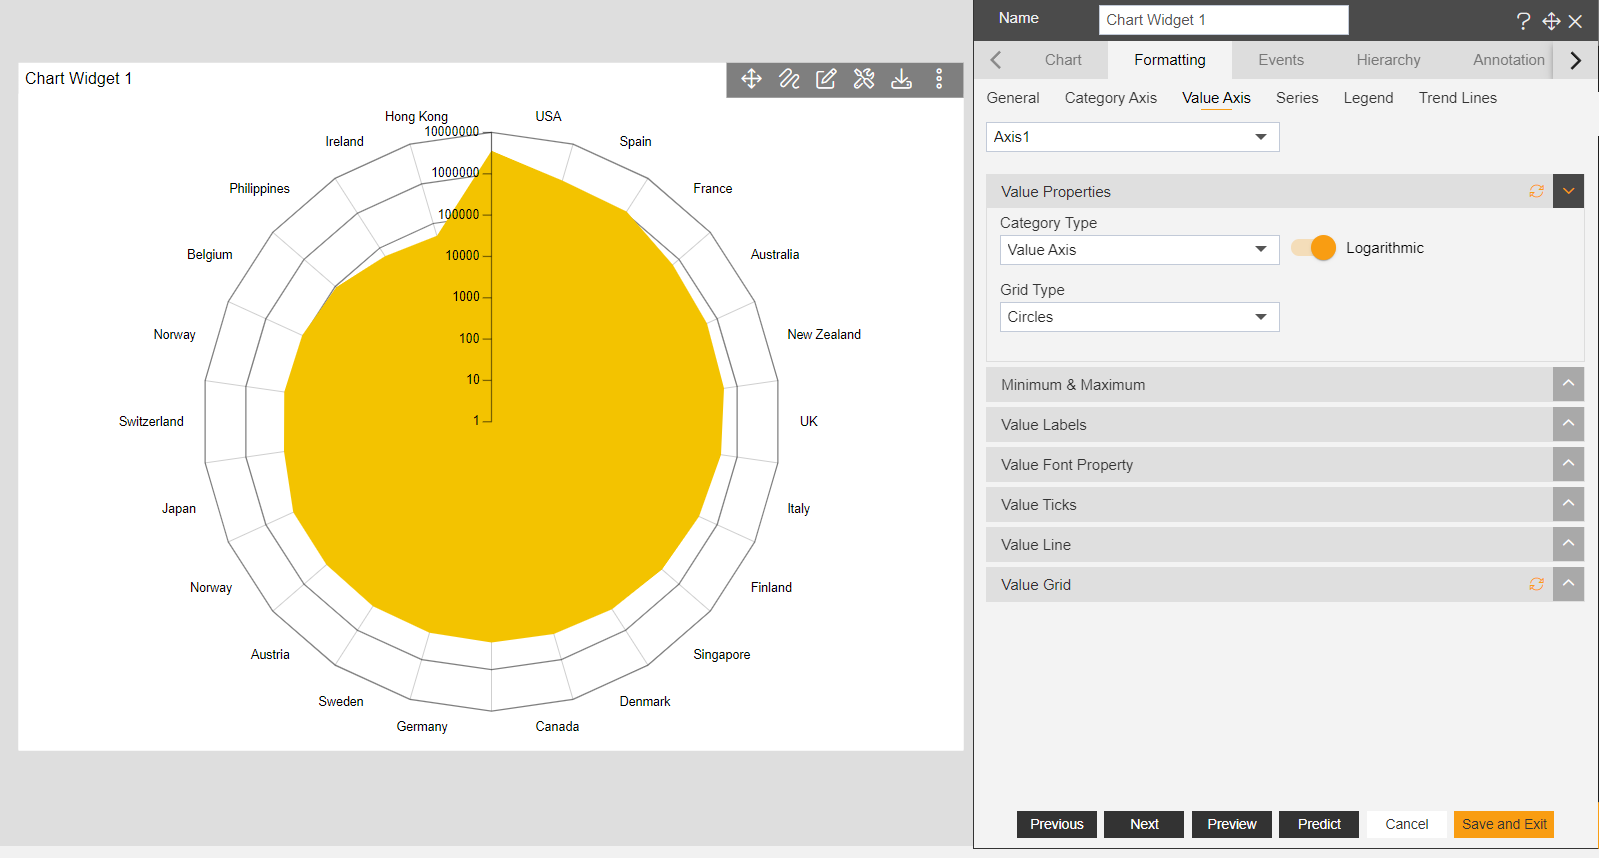
1. Logarithmic – user can enable this when user wants the value axis data to be in logarithmic format.
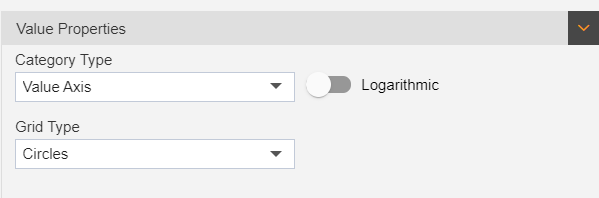
2. Category Type – This dropdown contains Value Axis & Duration Axis.
3. Value Axis – by selecting this option user can see their value format. (Value Axis is selected as default)
4. Grid Type – There is 2 option in this dropdown: Circles & Polygons. User can select any of this as required.
5. Duration Axis – by selecting this option user can see their data in duration format.
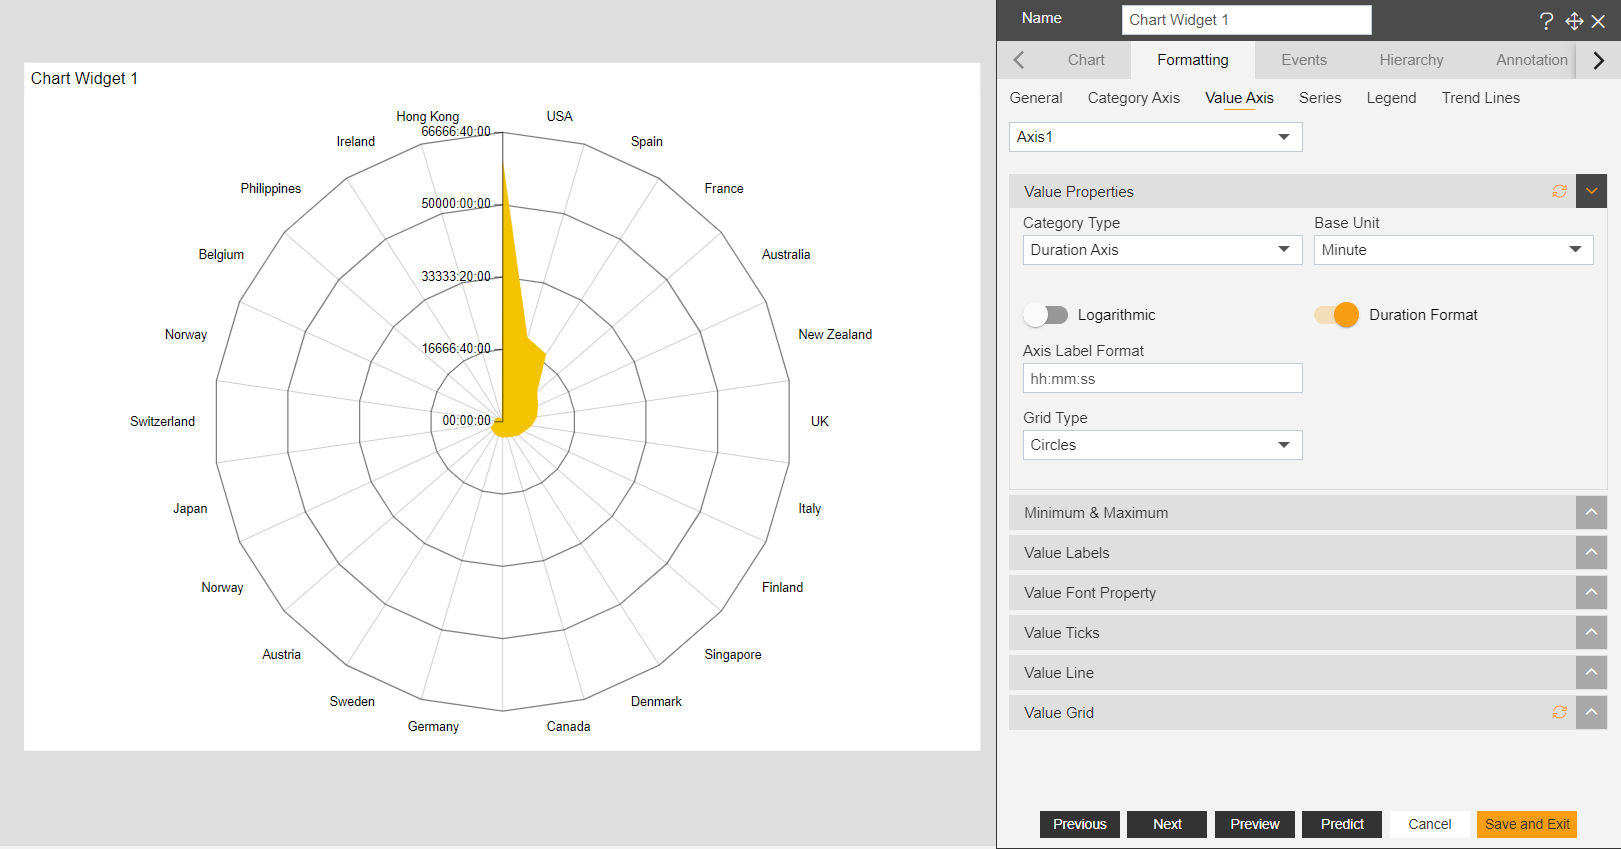
6. When user selects Duration Axis other option appears as shown in the image below:
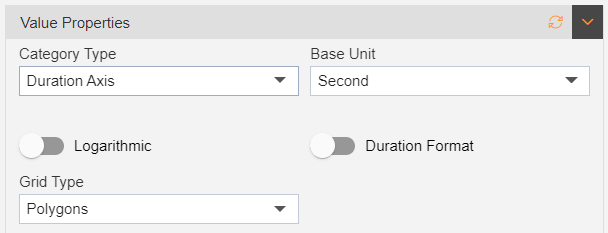
7. Base Unit – This function has 3 option in dropdown: Second, Minute & Hour. User can select that option as they decide that they want data in which format.
8. When user enables Duration Format option, new box will appear as shown:
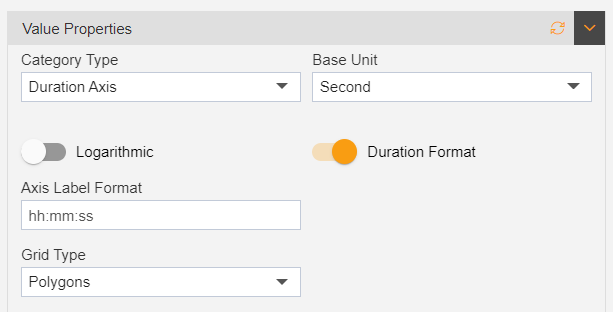
9. Axis Label Format – User can set this format as required.