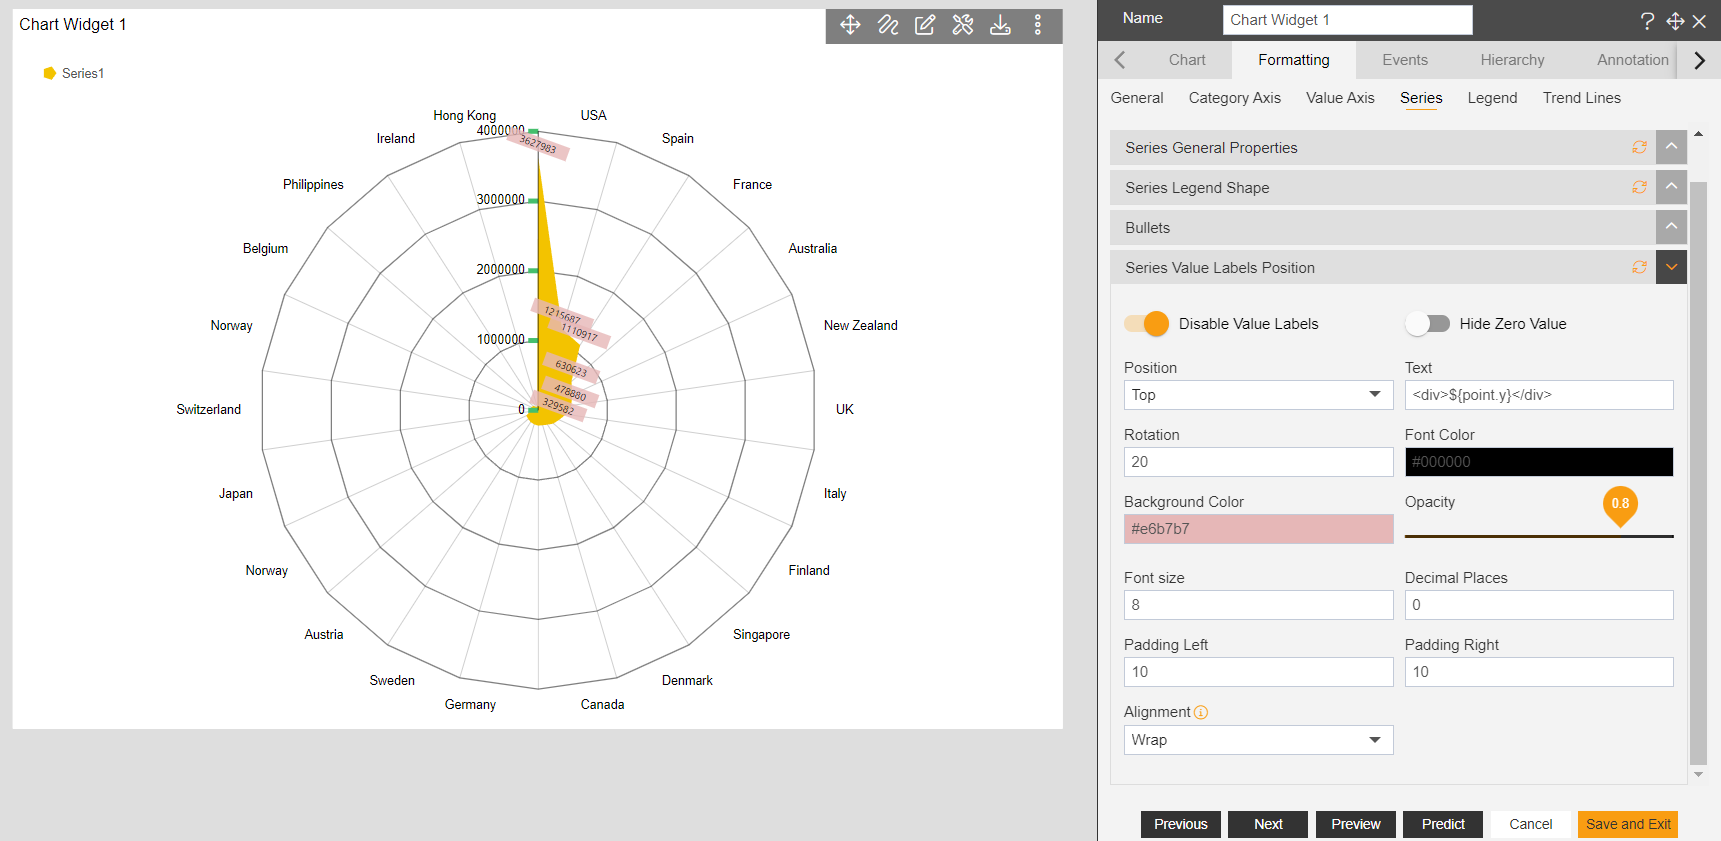
Radar chart > Series Value Labels Position
• Series Value Labels – User can add the value labels in the chart.
• Go to Edit Menu -> Formatting tab -> Series -> Series Value Label Position.
1. When the user toggle enables value labels button, options will appear as shown in the image below.
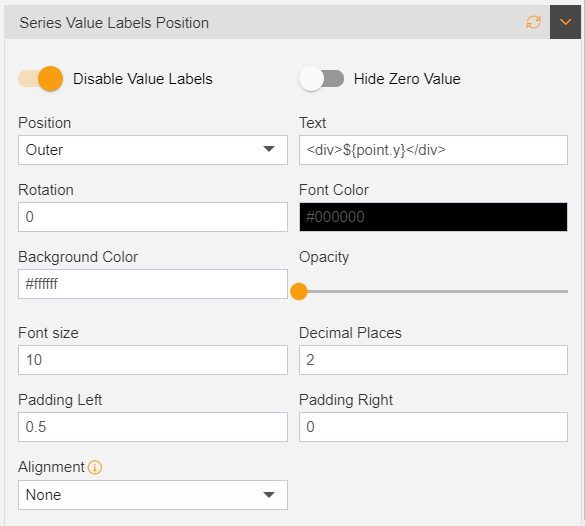
2. Position – user can make changes to the position of series value labels by selecting the options from the dropdown.
•Outer – user can shift value labels to the outside of the chart.
•Top – shift value labels to the top of the chart.
•Bottom – shifts value labels to the bottom of the chart.
•Middle – shifts value labels to the middle of the chart.
3. Hide Zero Value – user can hide zero value, if dataset had any of “0” value then this option hides them. If there is no “0” value then it will look as usual.
4. Text – user can put the text value in particular pattern, as shown in above given image. It contains ${point.y}, it displays the value axis in series labels. If user puts ${point.x} it will reflect the Category Axis data in series labels.
5. Rotation – user can control the rotation of label positions.
6. Font Color – used to set the font color of labels.
7. Background color – used to set the background color of the labels.
8. Opacity – used to control the visibility of the series value labels.
9. Font Size – used to control the font size of series value labels.
10. Decimal Places – used to control the number to be shown in series value labels.
11. Padding Left – used to set padding at the left of the value labels.
12. Padding Right – used to set padding at the right of the value labels.
13. Alignment – used to set the alignment of the series value labels.